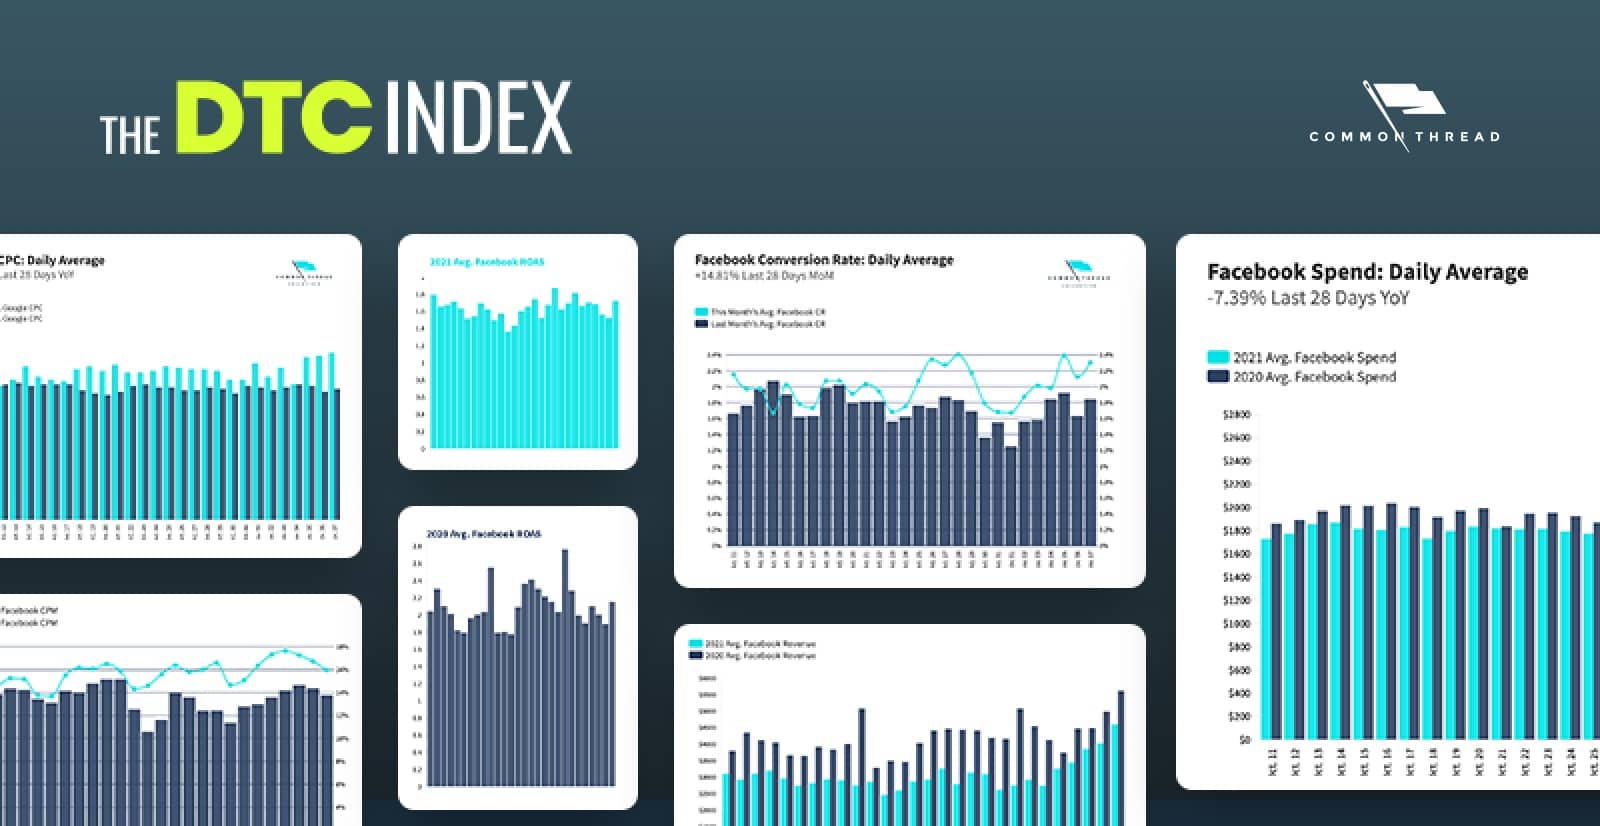
Exclusive Access to the DTC Metrics that Matter Most
27 Key Metrics, Updated Weekly
From store CAC to Facebook ROAS, the DTC Index contains charts tracking year-over-year data points from all parts of the funnel.
Subscribe Now

by Steven Rekuc
Apr. 06 2023
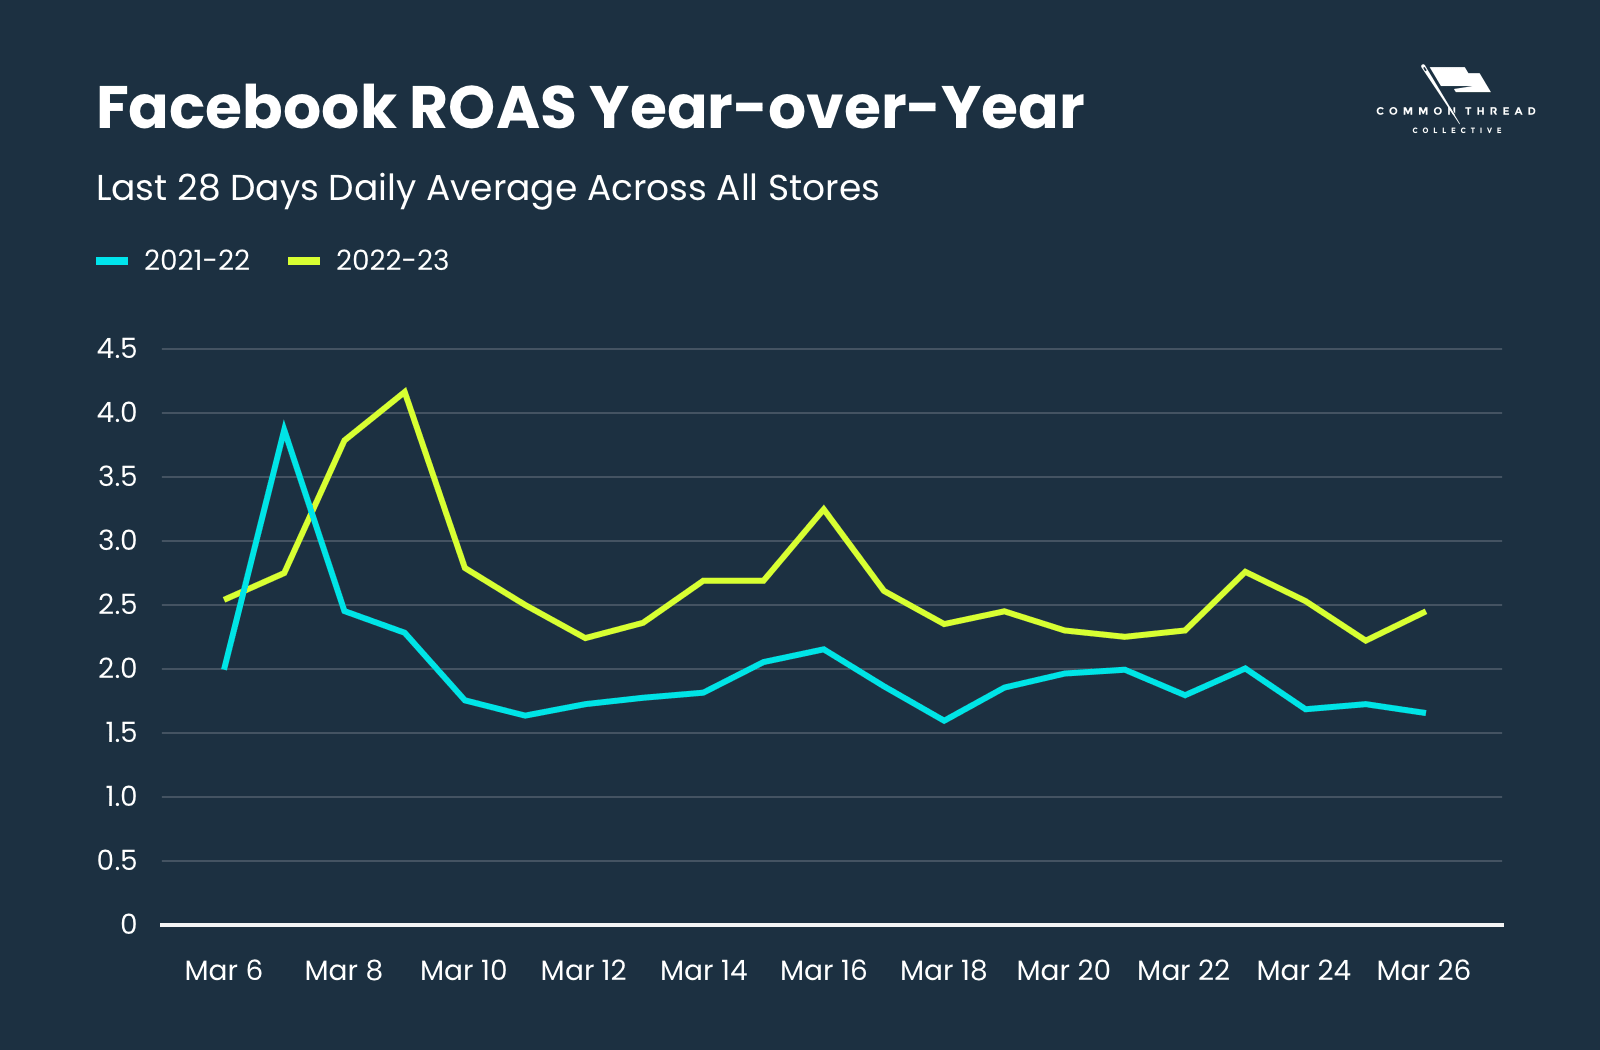
Despite the conventional wisdom about Facebook ROAS’ post-iOS14.5 decline, our dataset saw consistent gains in on-platform efficiency.
And that doesn’t seem to be changing anytime soon — Facebook ROAS is up 60.90% in the last 28 days Year-over-Year:
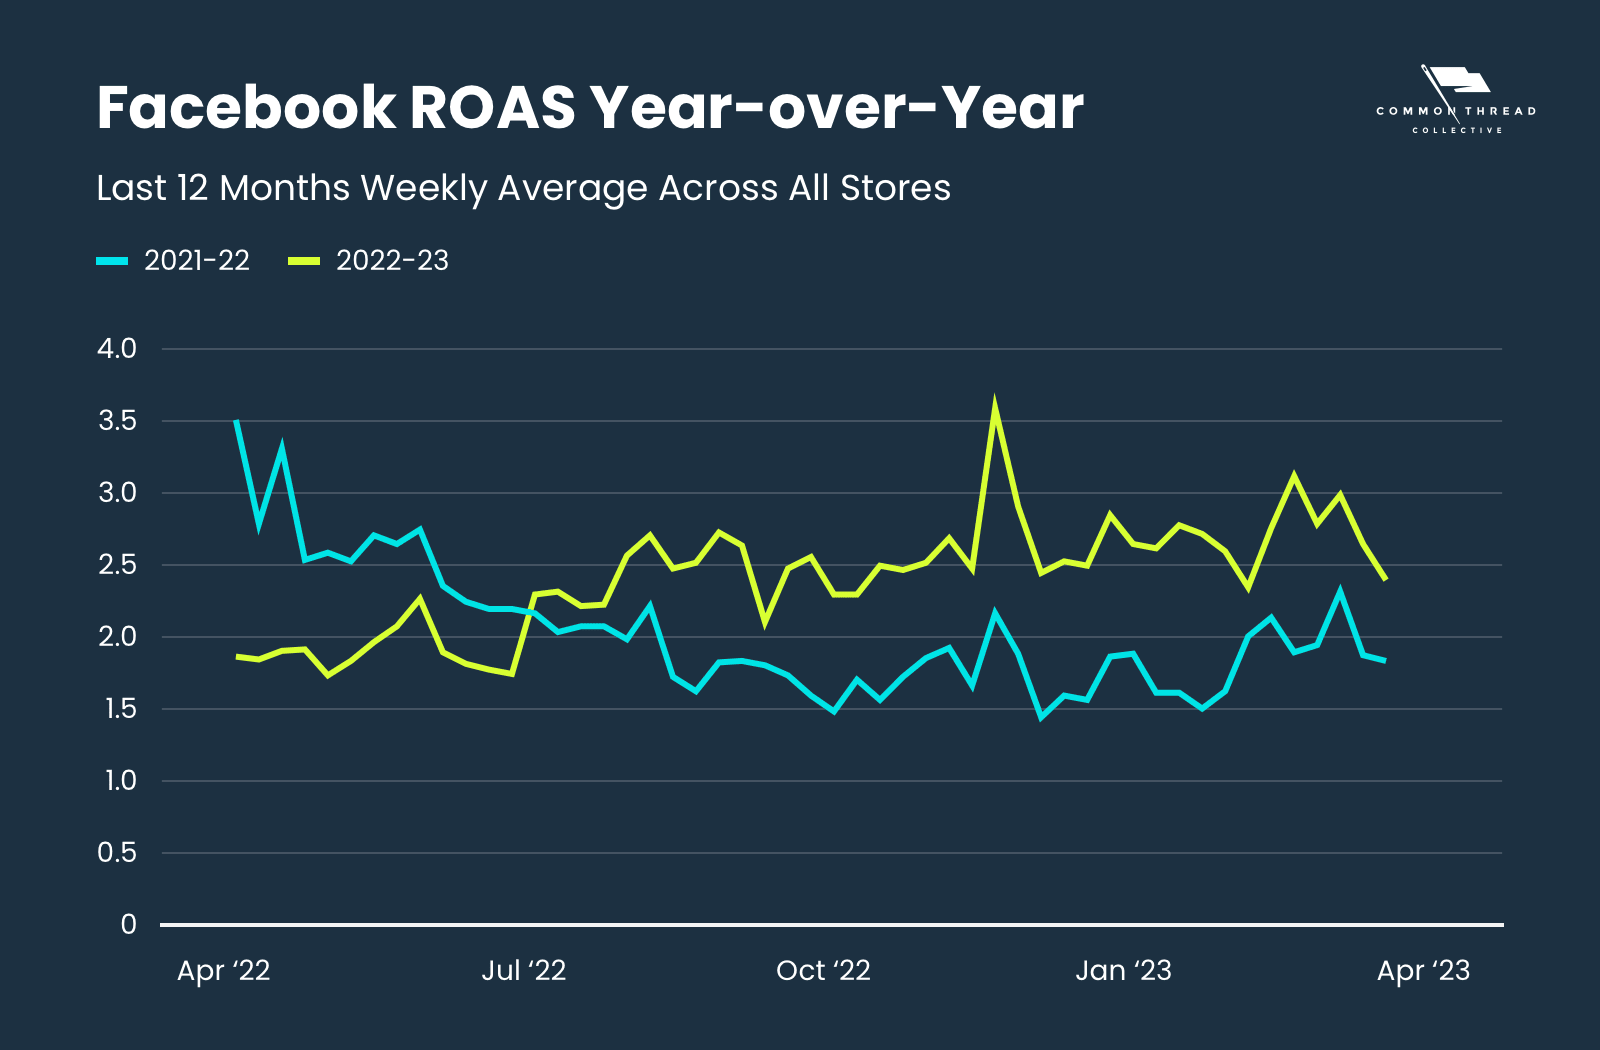
In the trailing 12 months, Facebook ROAS is up +8.12% over the previous year:
Does that mean everyone’s killing it on Facebook again? Are we back to pre-iOS14.5 levels of performance?
Hardly.
While the aggregate number looks like a big improvement, there are a few reasons this metric gets skewed and doesn’t apply to all brands.
We’ll dive into the three reasons ROAS looks better:
Plus: Why Google typically looks worse
If you follow our DTC Index, you may have noticed that Google ROAS and Revenue always appear down Year-over-Year in the short term.
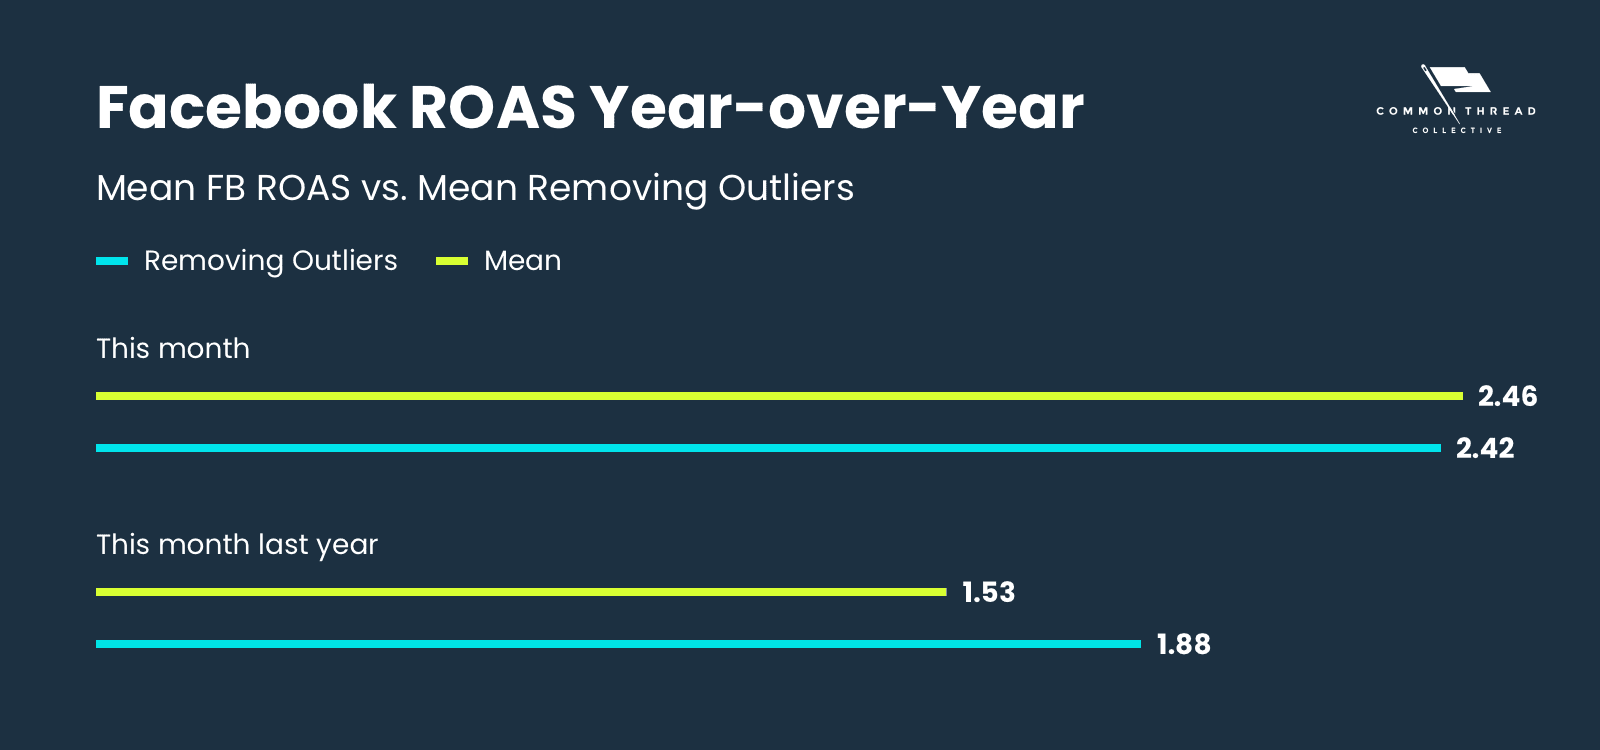
The performance of the overall data set is heavily influenced by a few brands that improved performance substantially Year-over-Year …
In fact, just 53% of the stores in our dataset are up in Facebook ROAS over the last 28 days, and there’s a great amount of variability in that performance.
So, how is combined ROAS up +60.90% in the last 28 days?
It’s a simple matter of outliers affecting the aggregate: 31 stores are up +100% YoY over that period.
Seems pretty great. But don’t get jealous of those store owners just yet.
Last year, 19 of those stores had a bad Facebook ROAS of <1; and, of those 19 stores, 10 had a sub-0.5 Facebook ROAS.
That means 19 stores that saw +100% improvement in FB ROAS were losing money on the first order last year from Facebook without even factoring in COGS and OPEX.
In summary, the massive percentage improvement in ROAS is due to certain stores going from a very bad place to an OK place.
That’s a good question; it’s something we’ve considered.
The simple answer is consistency — many of our verticals have far fewer stores than the 300+ in our total dataset. If we chose to eliminate outliers from our All Stores number, we would have to do that for each vertical that we compute and that could make those data sets smaller than we would like.
We do, however, publish median Marketing Efficiency Ratio (MER).
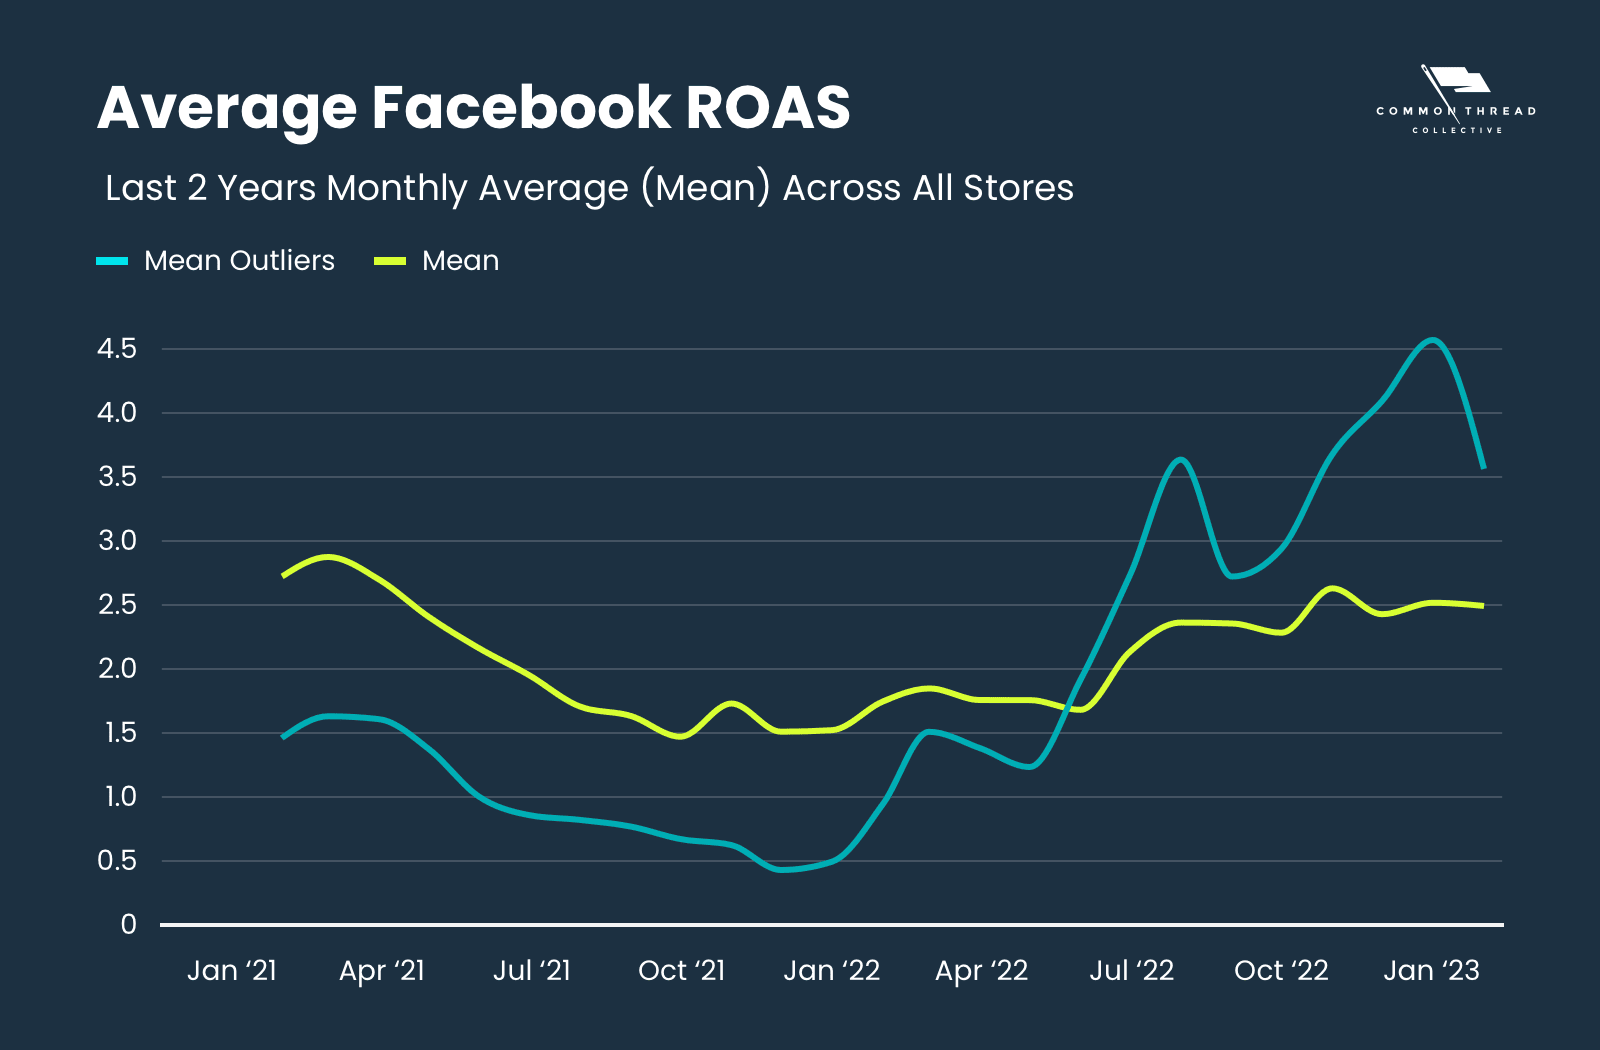
And, even with outliers removed from the dataset, ROAS is still up +28.63% YoY.
Put simply, brands favor the ad platforms that work for them.
If an ad platform isn’t profitable, they’ll stop using that platform.
This happened with 21 of our stores: the brands spent into Facebook last year at this time, but have since turned it off.
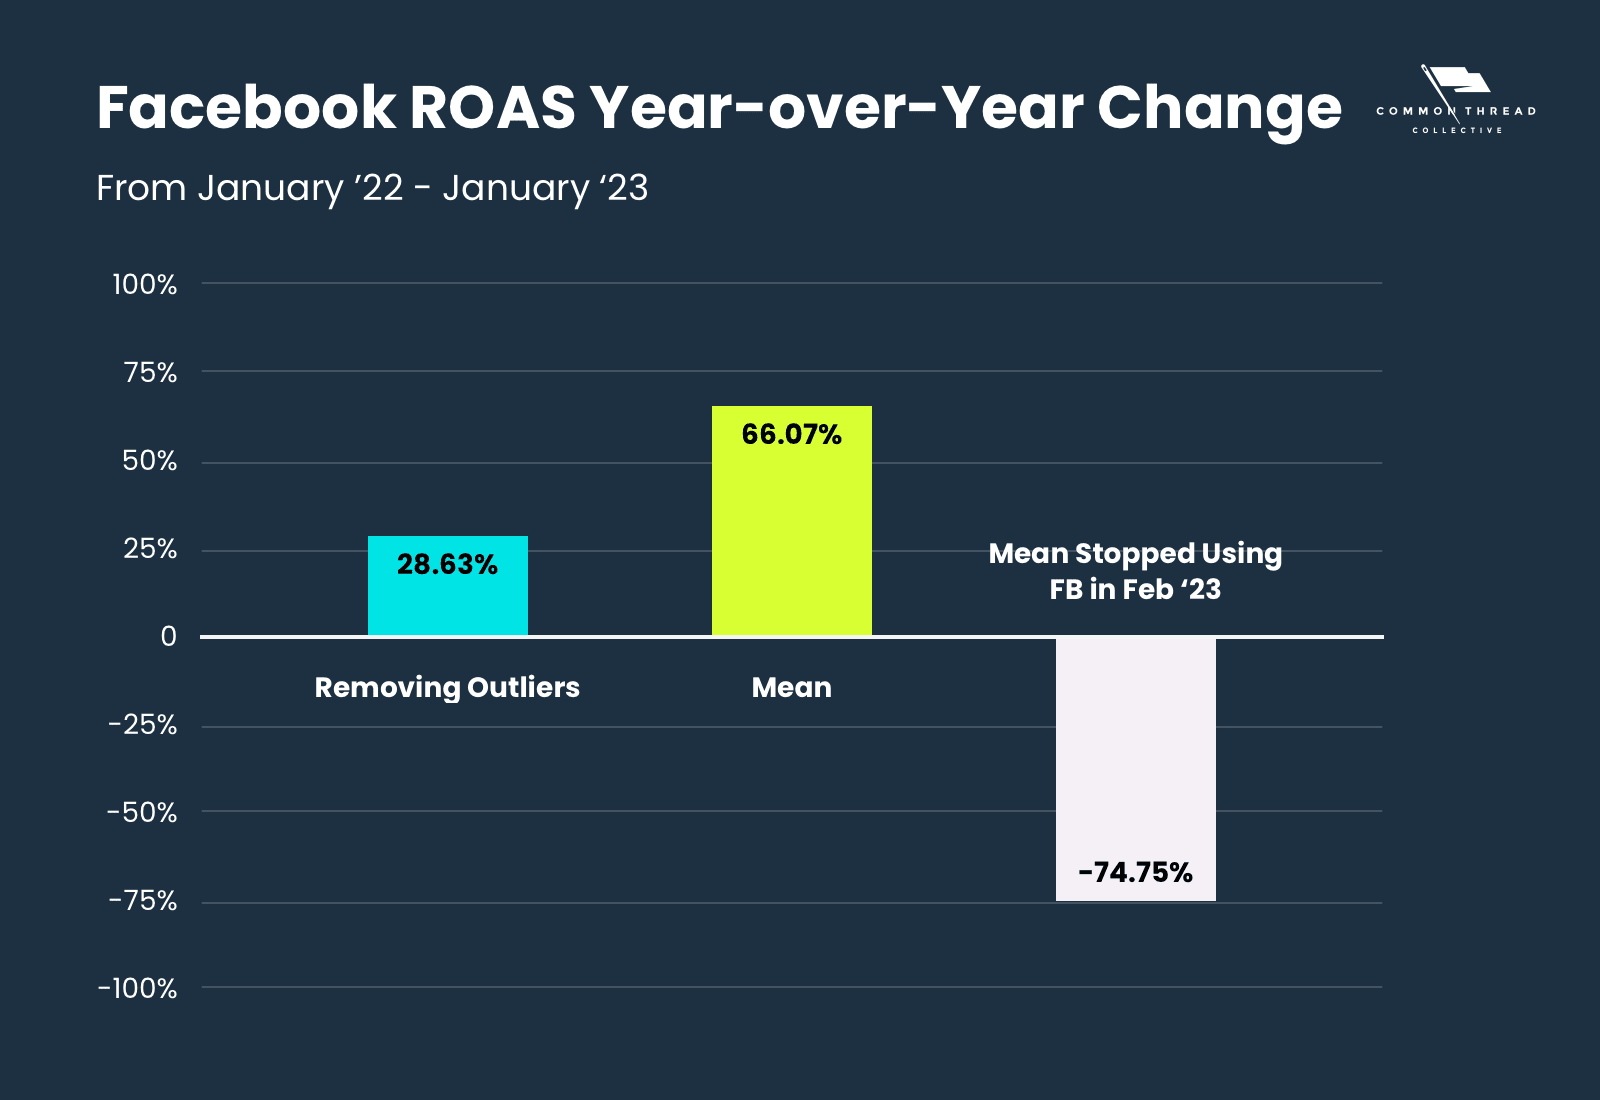
Since those brands turned off Facebook, they aren’t counted in the Facebook ROAS aggregate average.
On average, these brands went from a respectable 2.16 ROAS in January 2022 to a 0.54 ROAS in January of 2023.
With that 75% drop YoY, it’s no wonder they turned off Facebook spend.
Since they collectively turned Facebook off in February 2023, their year-over-year drop is not reflected in the average Facebook ROAS, thus drastically improving the performance of Facebook ROAS year-over-year.
We’ve talked before about how consumer confidence impacts aggregate MER and Customer Acquisition Cost.
We’ve also looked at how consumer confidence impacts acquisition Marketing Efficiency Ratio (aMER).
So it’s no surprised that the Consumer Confidence Index correlates well with Facebook ROAS.
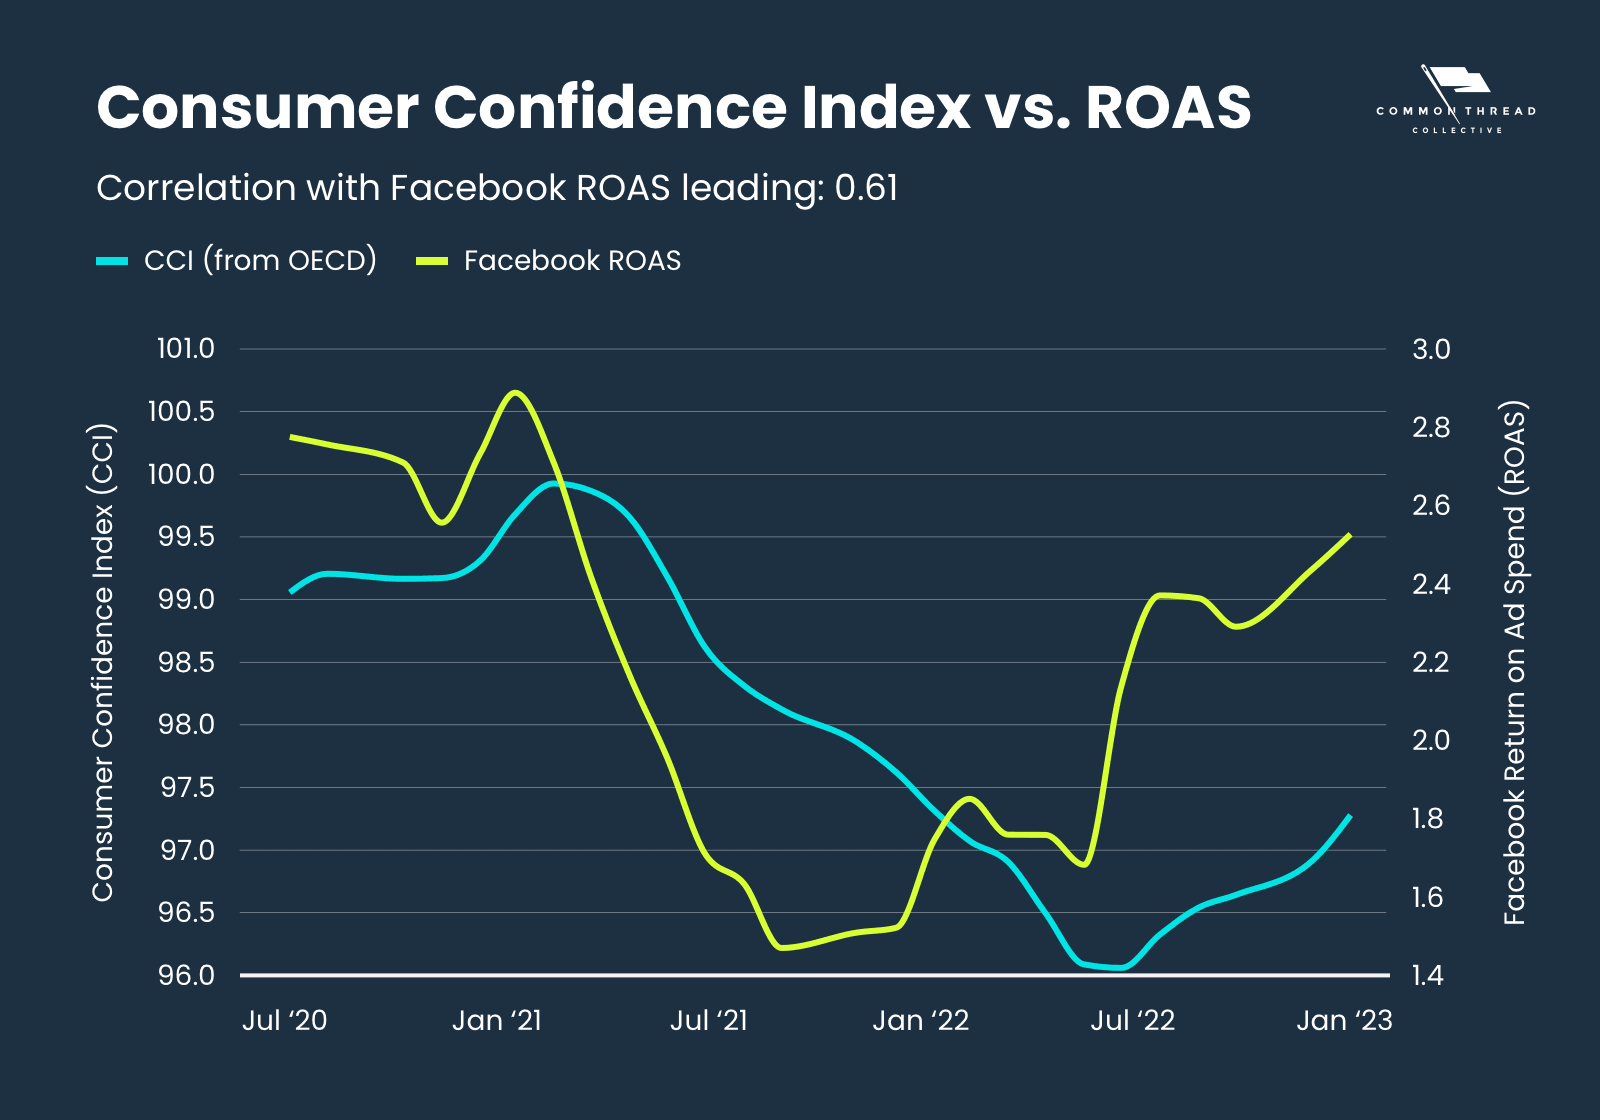
More specifically, our aggregate Facebook ROAS looks like a LEADING indicator for the Consumer Confidence Index — improvements in July Facebook ROAS correlate to an increase in August CCI.
So all of this applies to Google Ads, right?
Kind of … but Google has its own problems, and one in particular differentiates it from Facebook.
If you’re a follower of our DTC Index, you may have noticed that Google ROAS and Revenue always appear down Year-over-Year in the short term.
Some Performance Max haters might say so, but that’s a different story and probably not the main reason.
It’s actually a nuance of Google Attribution.
Unlike Facebook Ads, Google Ads attributes the purchase back to the date of the click.
Not the date of the purchase.
Here’s an example:
If your customer clicks on a Google Ad on Monday, but doesn’t convert until Friday, Monday gets that revenue attribution … even in last click.
What does that look like?
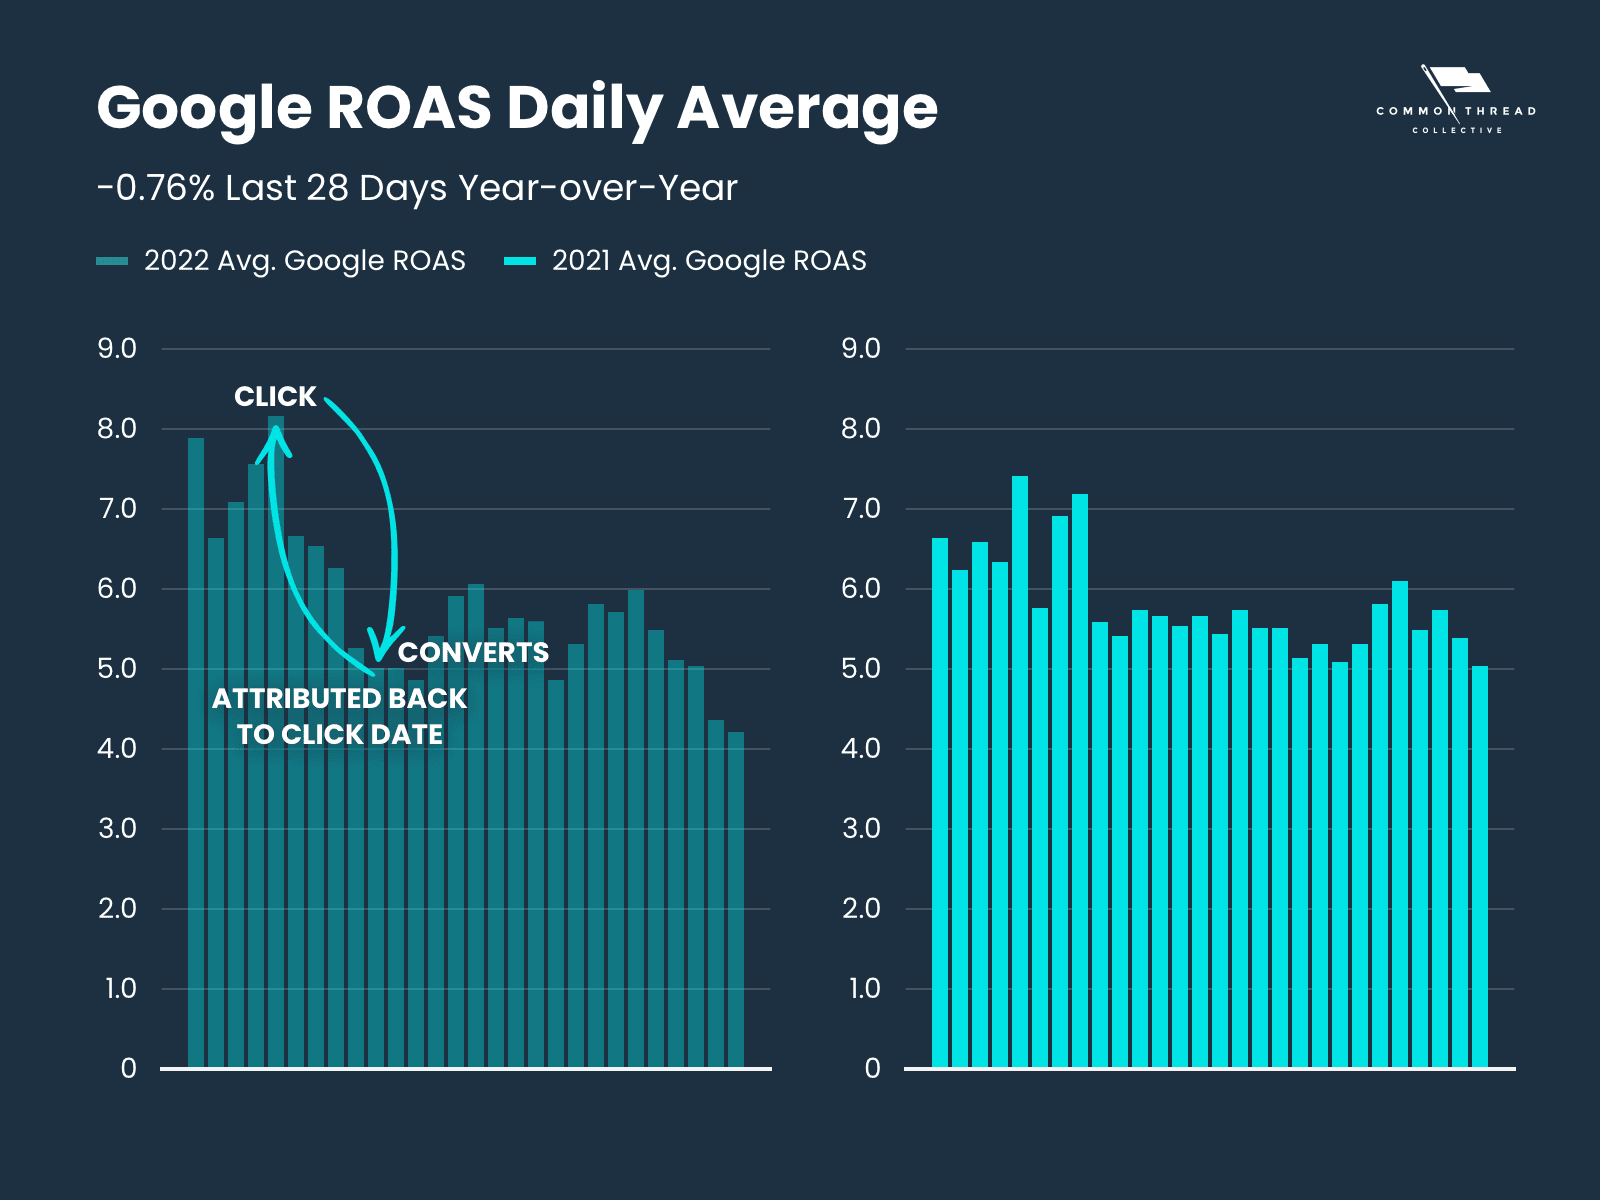
So Google Revenue (and ROAS) will pretty much always be down in the short-term.
Google Conversions will approach the real total number of conversions more quickly at first and then more slowly as it gets closer to 90 days. Some stores have their attribution set as far as 90 days in Google. After 90+ days, you’re set to compare year-over-year: all of the conversions should be counted by Google.
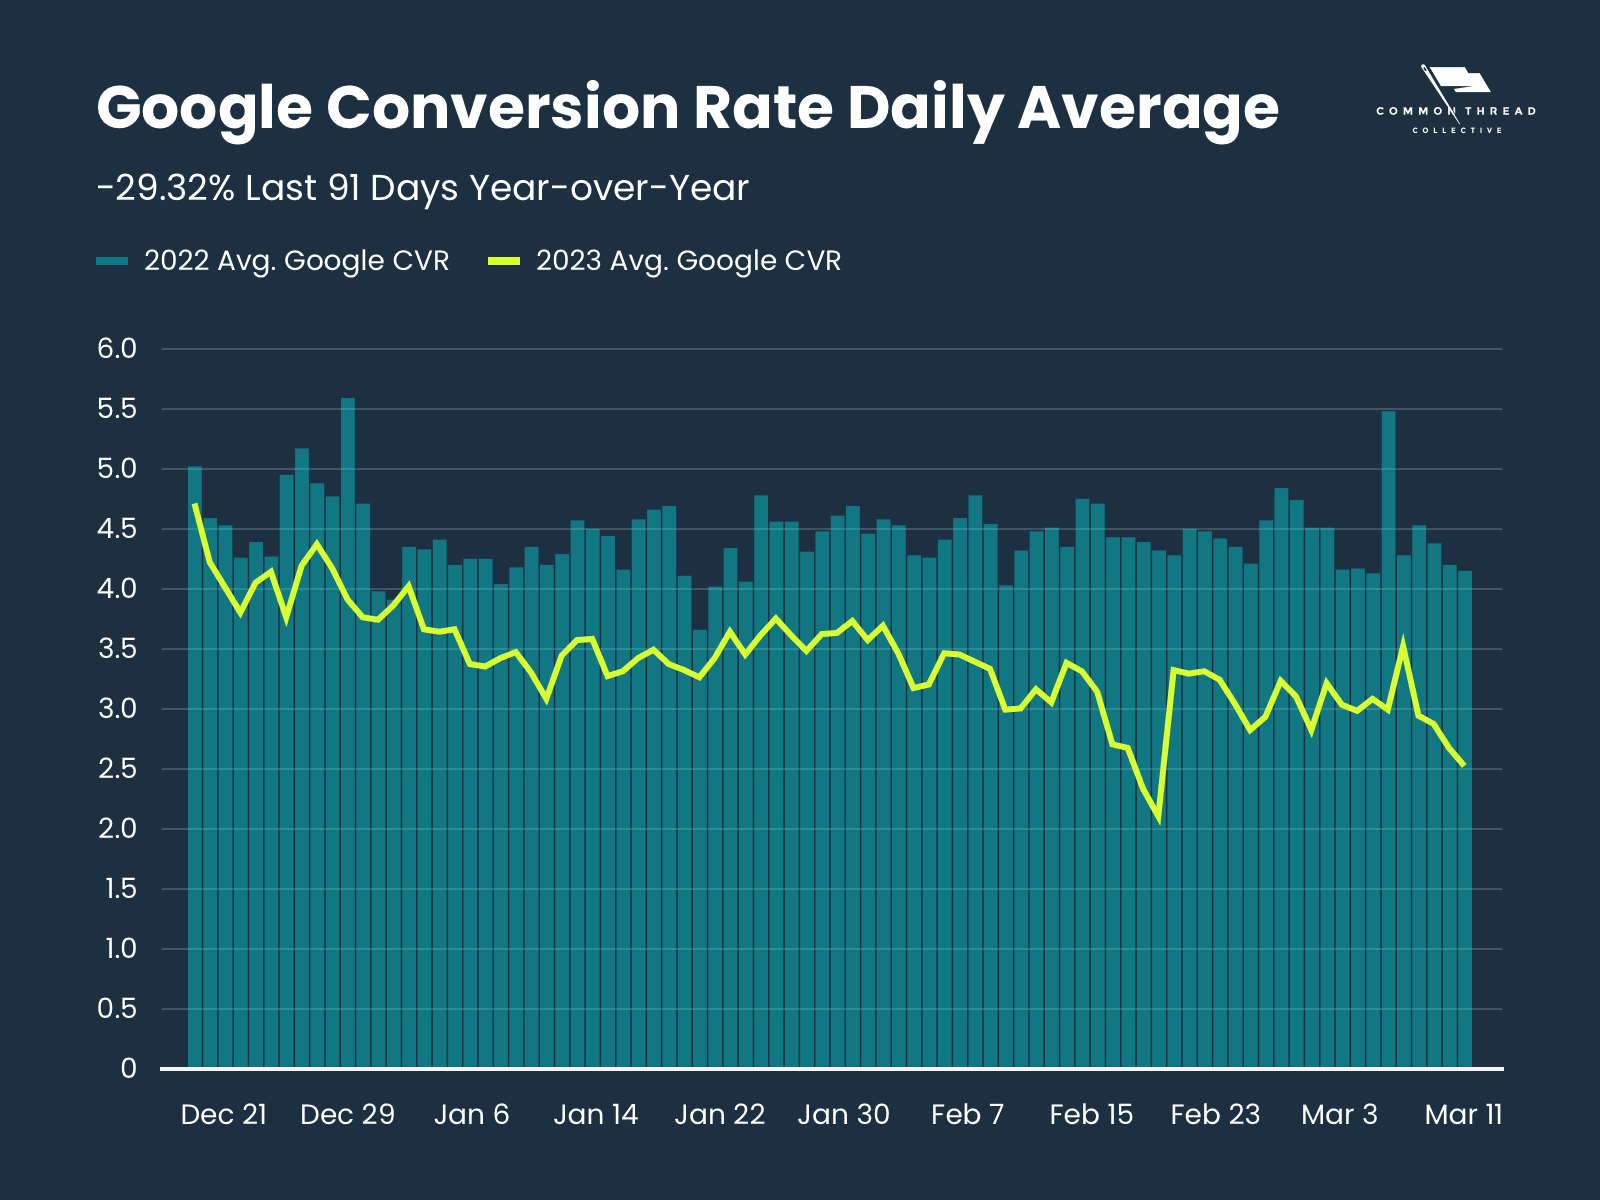
In our “All Stores” vertical, we see a lot of conversions happening within a week or 2 from that first click. Then more will trickle in.
Are you interested in seeing out how these impacts on the data play out in real Ecommerce data? We recommend signing up for our DTC Index.

27 Key Metrics, Updated Weekly
From store CAC to Facebook ROAS, the DTC Index contains charts tracking year-over-year data points from all parts of the funnel.
Subscribe Now
Steve Rekuc is the Ecommerce Data Analyst at Common Thread Collective. Based in Vail, Colorado, he has been analyzing data from a systems perspective since his time as a graduate student at Georgia Tech two decades ago. Steve can be found on Twitter and LinkedIn examining data and providing interesting insights into ecommerce, marketing, and data analysis.