
What is Consumer Confidence and Why Does it Matter for your DTC Business?

by Steven Rekuc
Jun. 20 2023
A long, long time ago — in a world before the Internet — economists had a stunning realization: If consumers felt good about their financial situation, they would buy more; if they felt worse about their finances, they would buy less.
Determined to quantify this property, the top economic minds of the 1960s created the Consumer Confidence Index (CCI), a survey that puts a number to cumulative consumer sentiment in the United States.
We’ll be honest — we didn’t pay much attention to the CCI until summer of 2022, when we observed two things simultaneously:
- Our brands saw an aggregate -6.12% drop in Marketing Efficiency Rating (total revenue/total ad spend) in the trailing 12 months
- Gas prices hit all-time highs in June 2022 (source: AAA)
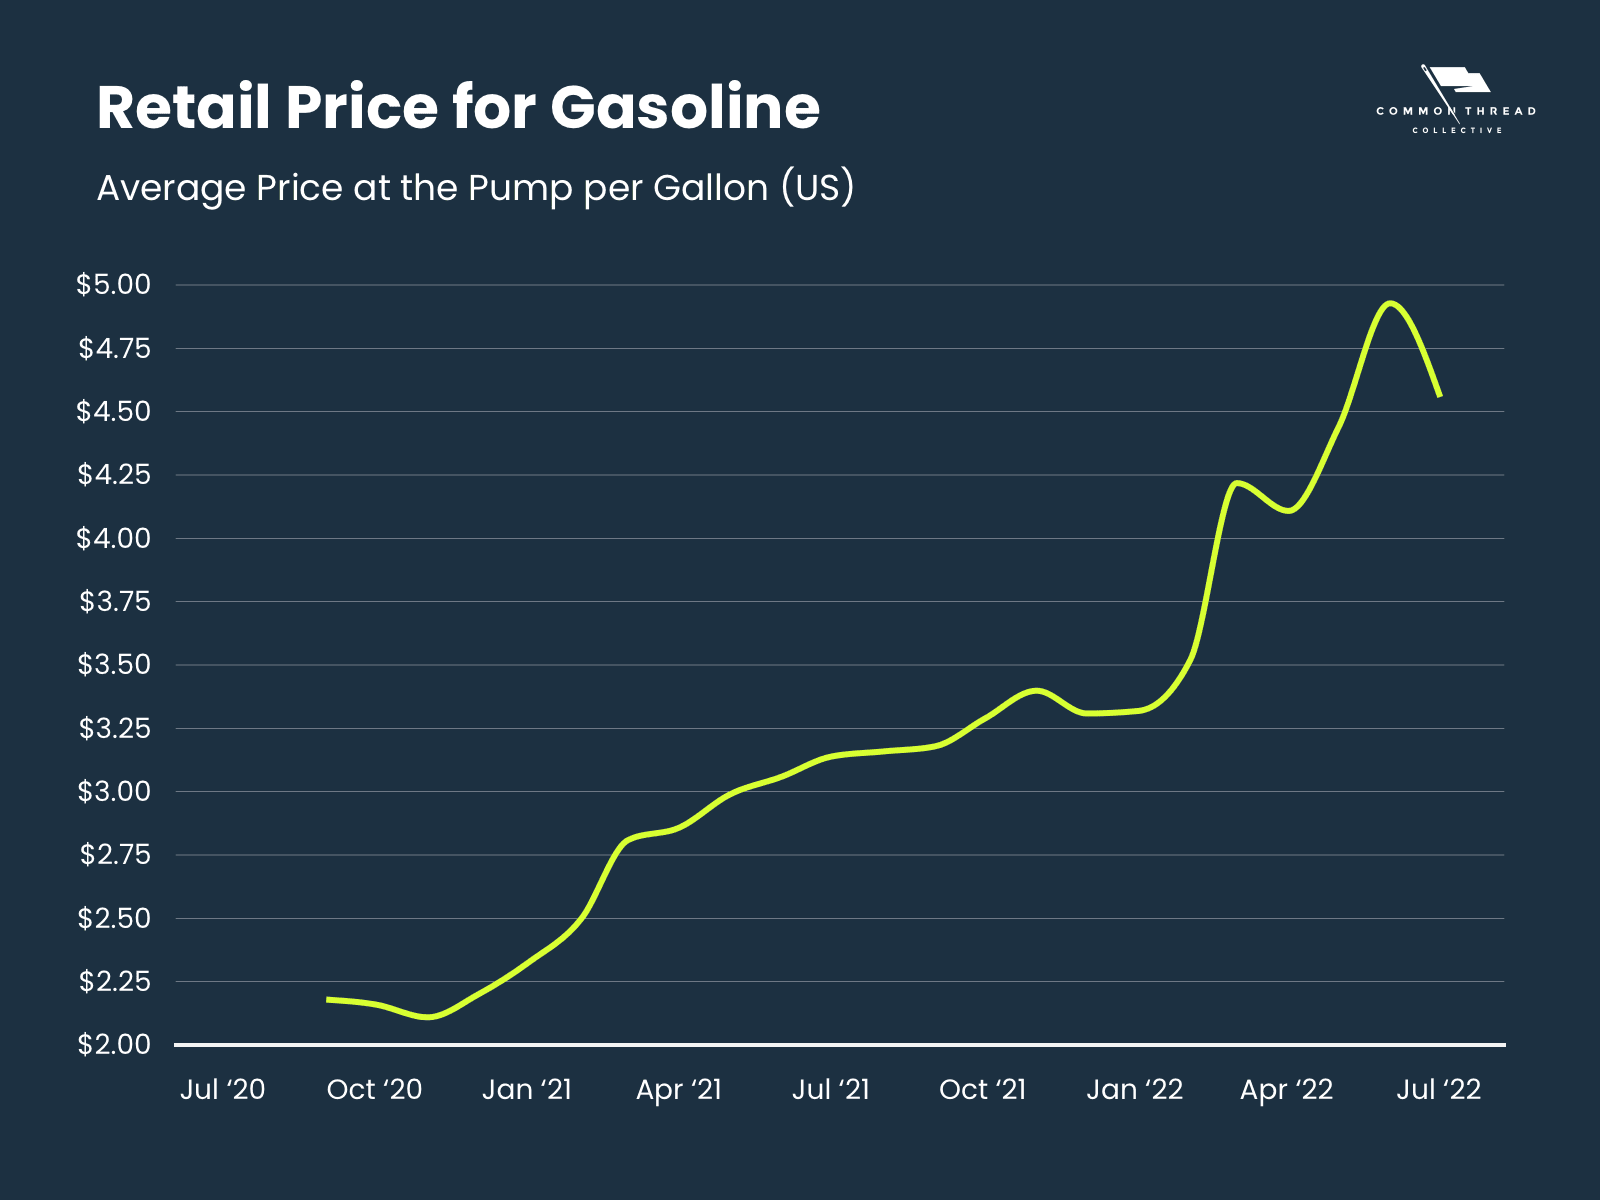
With talk of inflation and recession dominating the news cycle, gas prices were clearly just part of the story.
Since direct-to-consumer gas isn’t a thing (yet?), we looked at other CPIs more applicable to ecommerce:
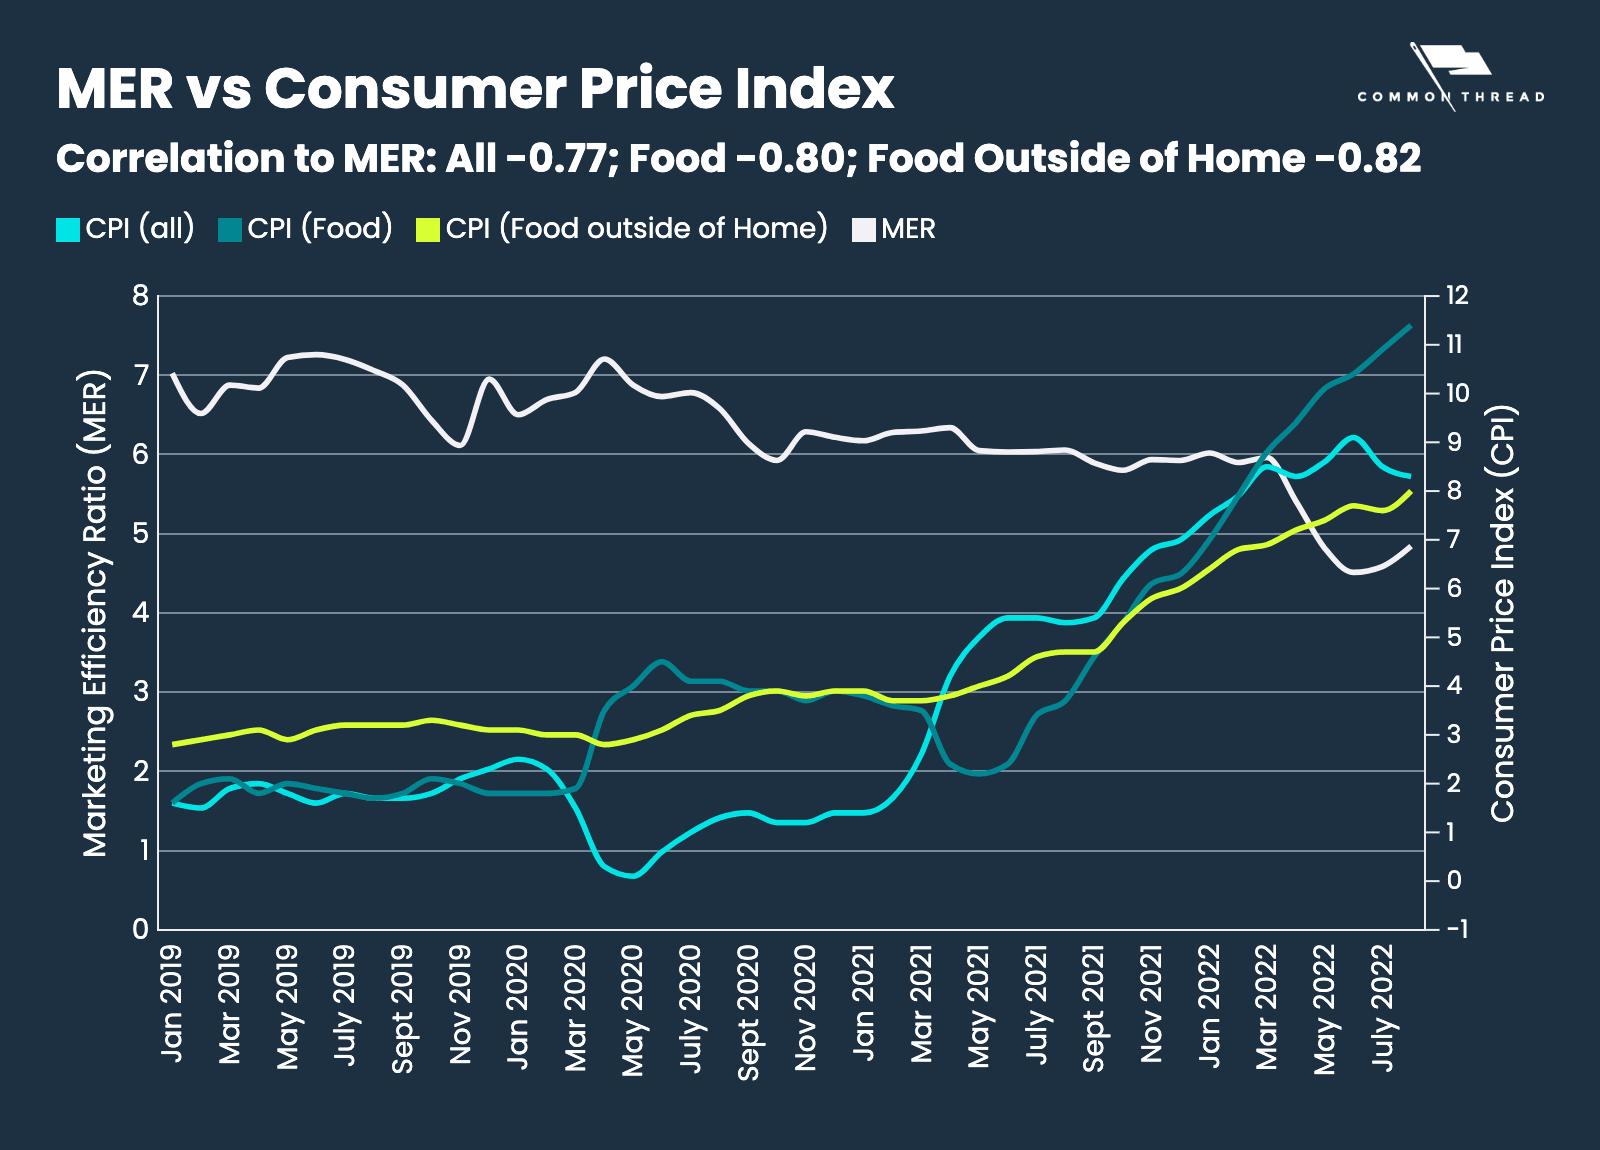
While food prices painted a more-relevant picture than gas prices, we ultimately wanted a general reading of consumer spending in the economy.
And that led us to the Consumer Confidence Index.
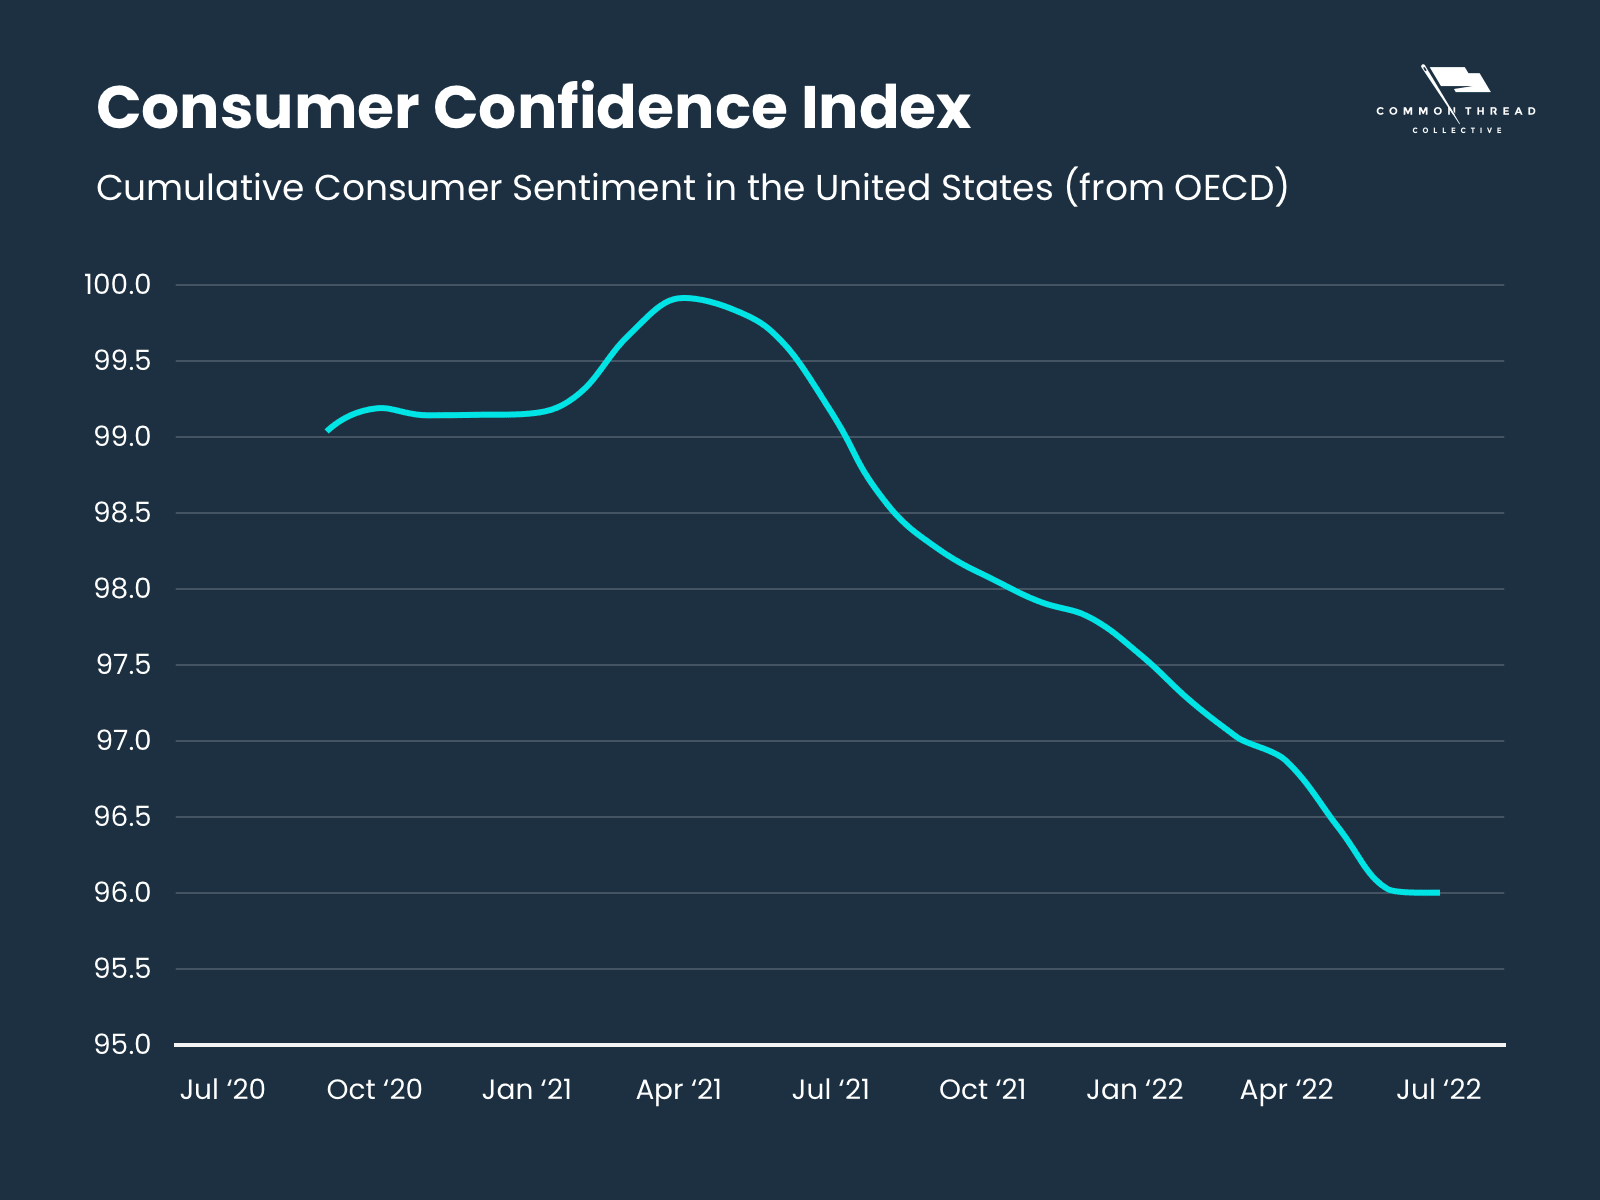
One thing was clear: The Consumer Confidence Index hit a low point in June ‘22 … and that coincided with our brands’ worst struggles.
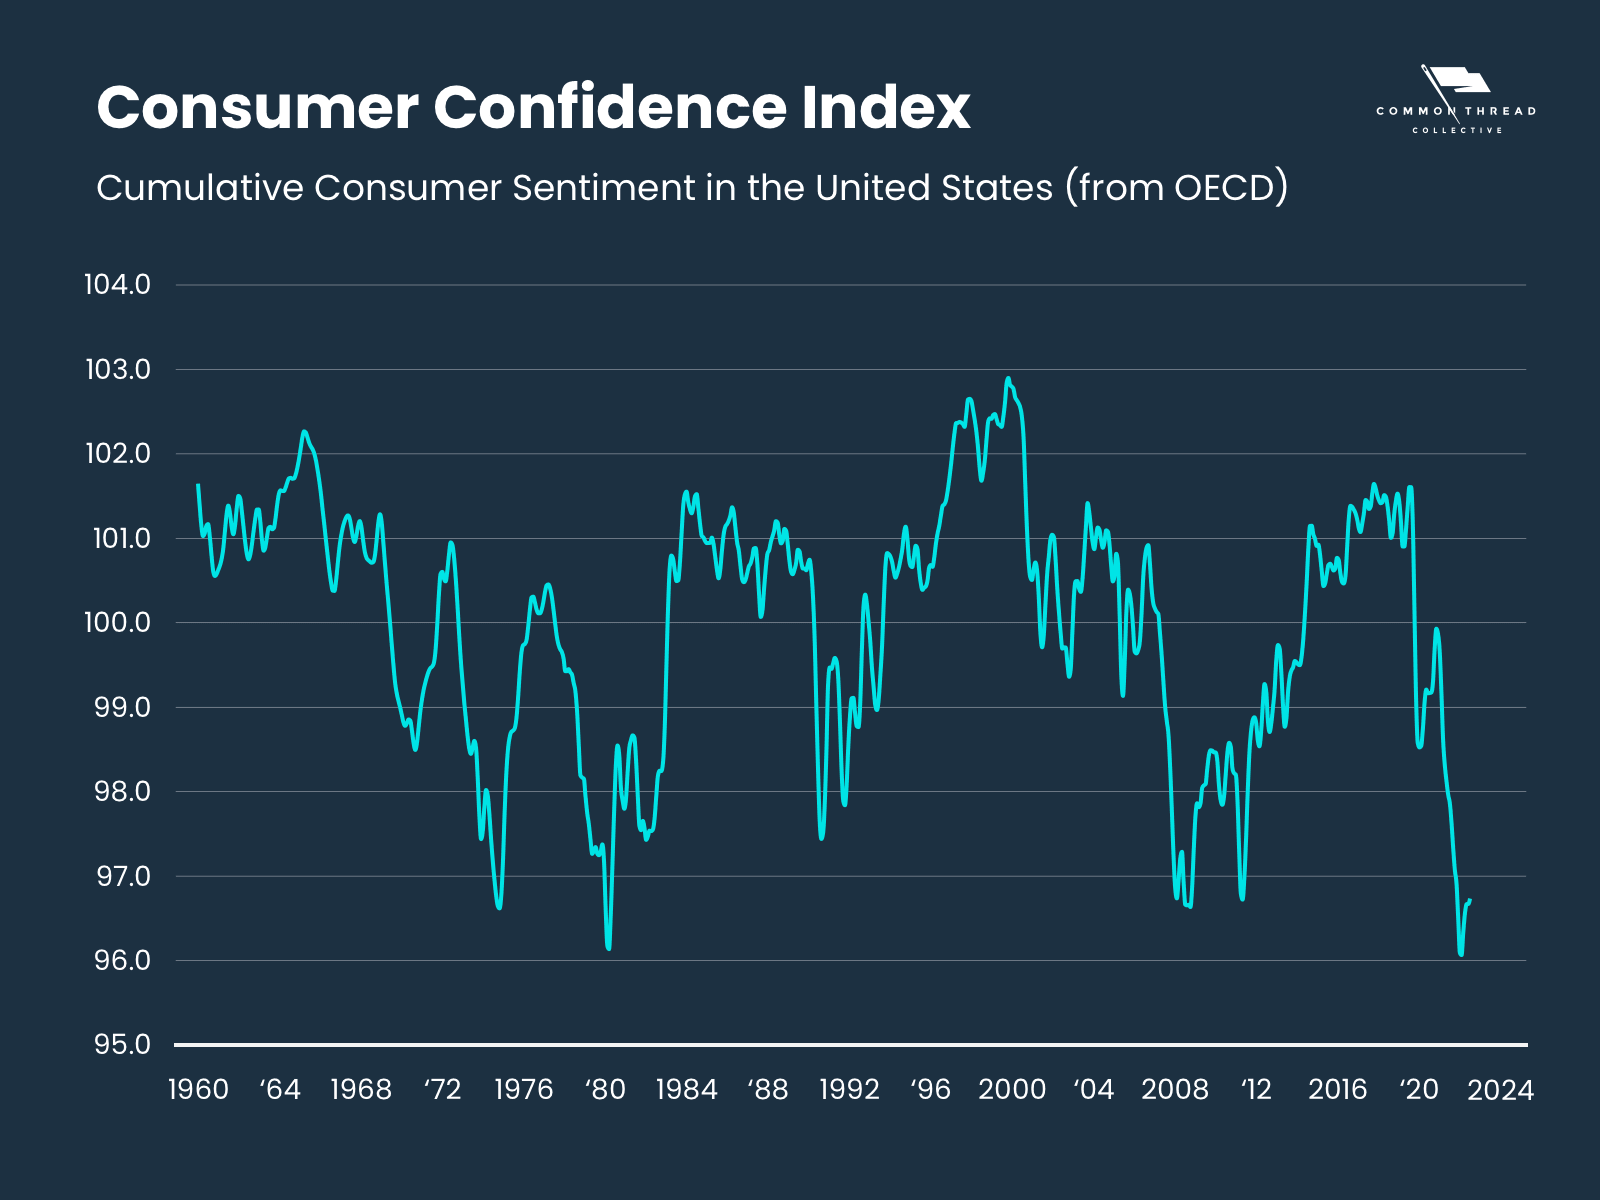
But consumer confidence wasn’t just bad that summer; it was the lowest Consumer Confidence Index ever reported.
And then July was even worse.
In fact, June and July 2022 held the worst confidence score in the 60-year history of the CCI.
So consumers were historically un-confident, and ecommerce efficiency was declining. These felt related, but were they correlated?
The answer was a clear “yes.”
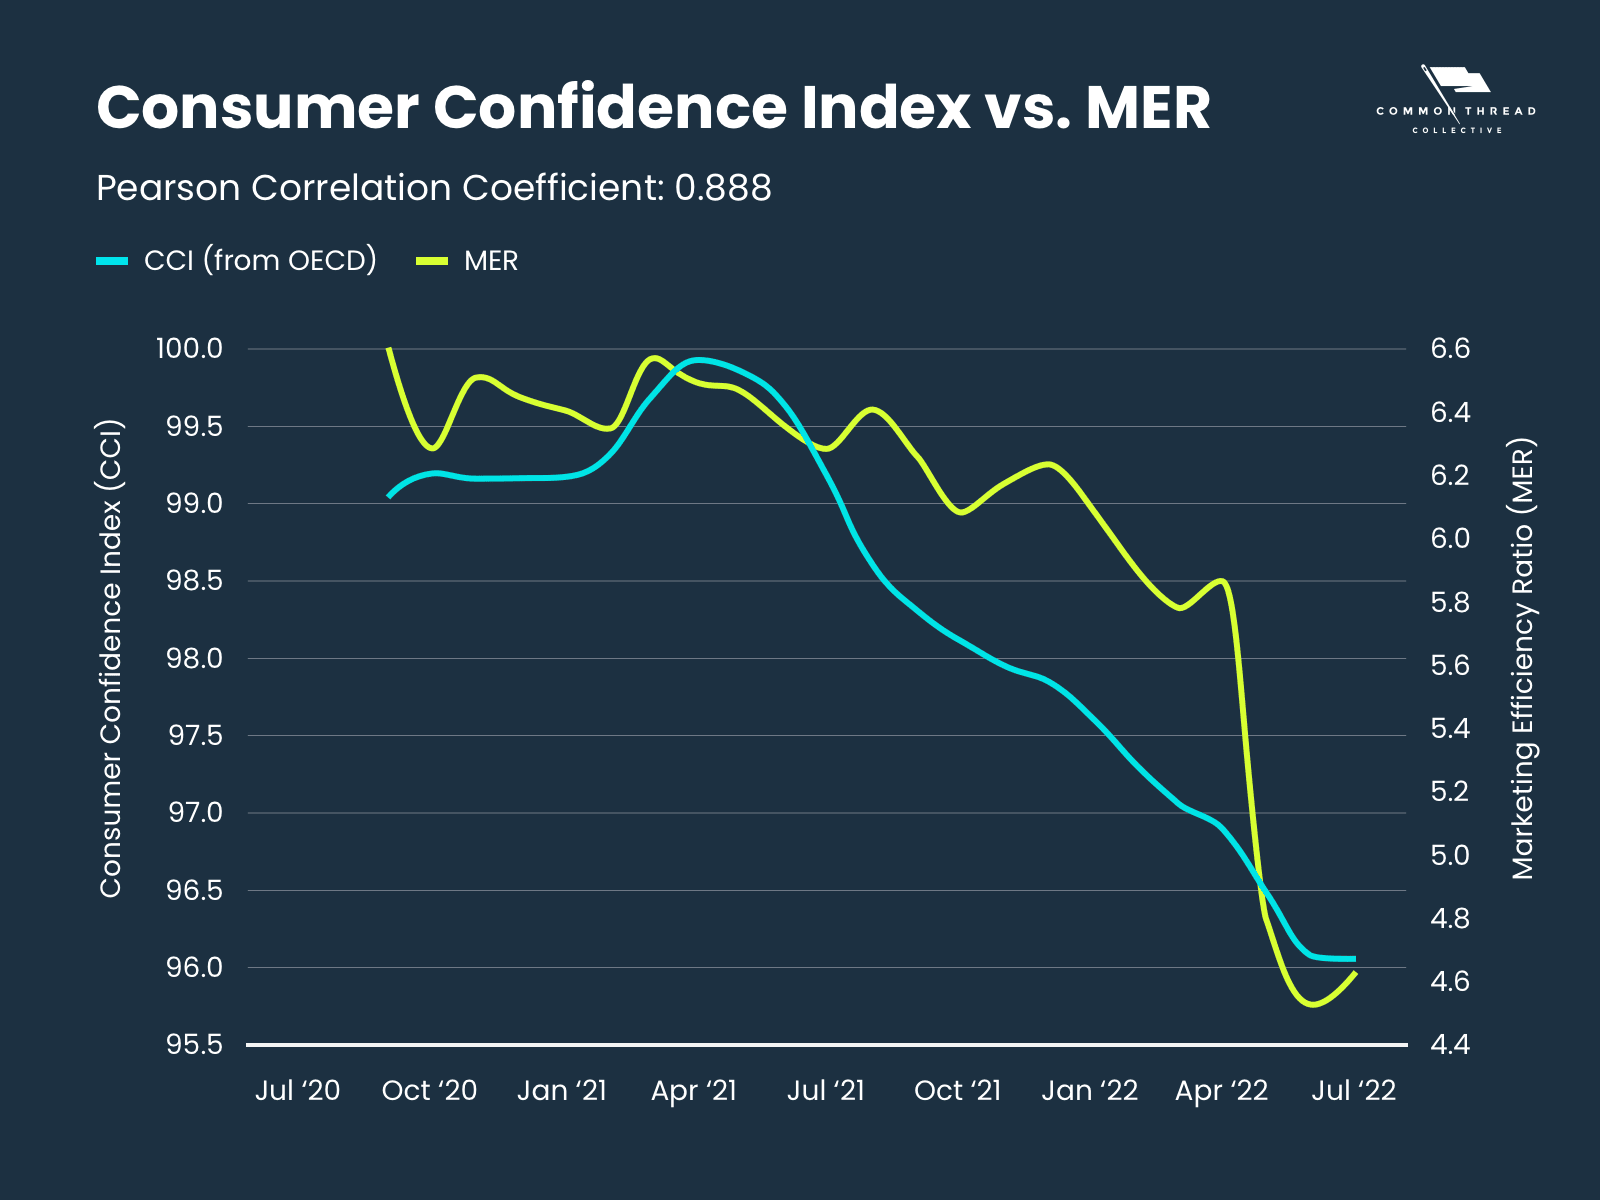
CCI and MER are correlated with a coefficient of 0.888 on a scale of -1 to 1; in plain English, this means the CCI and MER move in proportion to one another.
This makes a lot of sense: if consumers are less confident, it takes more ad spend to convince them to purchase the same products.
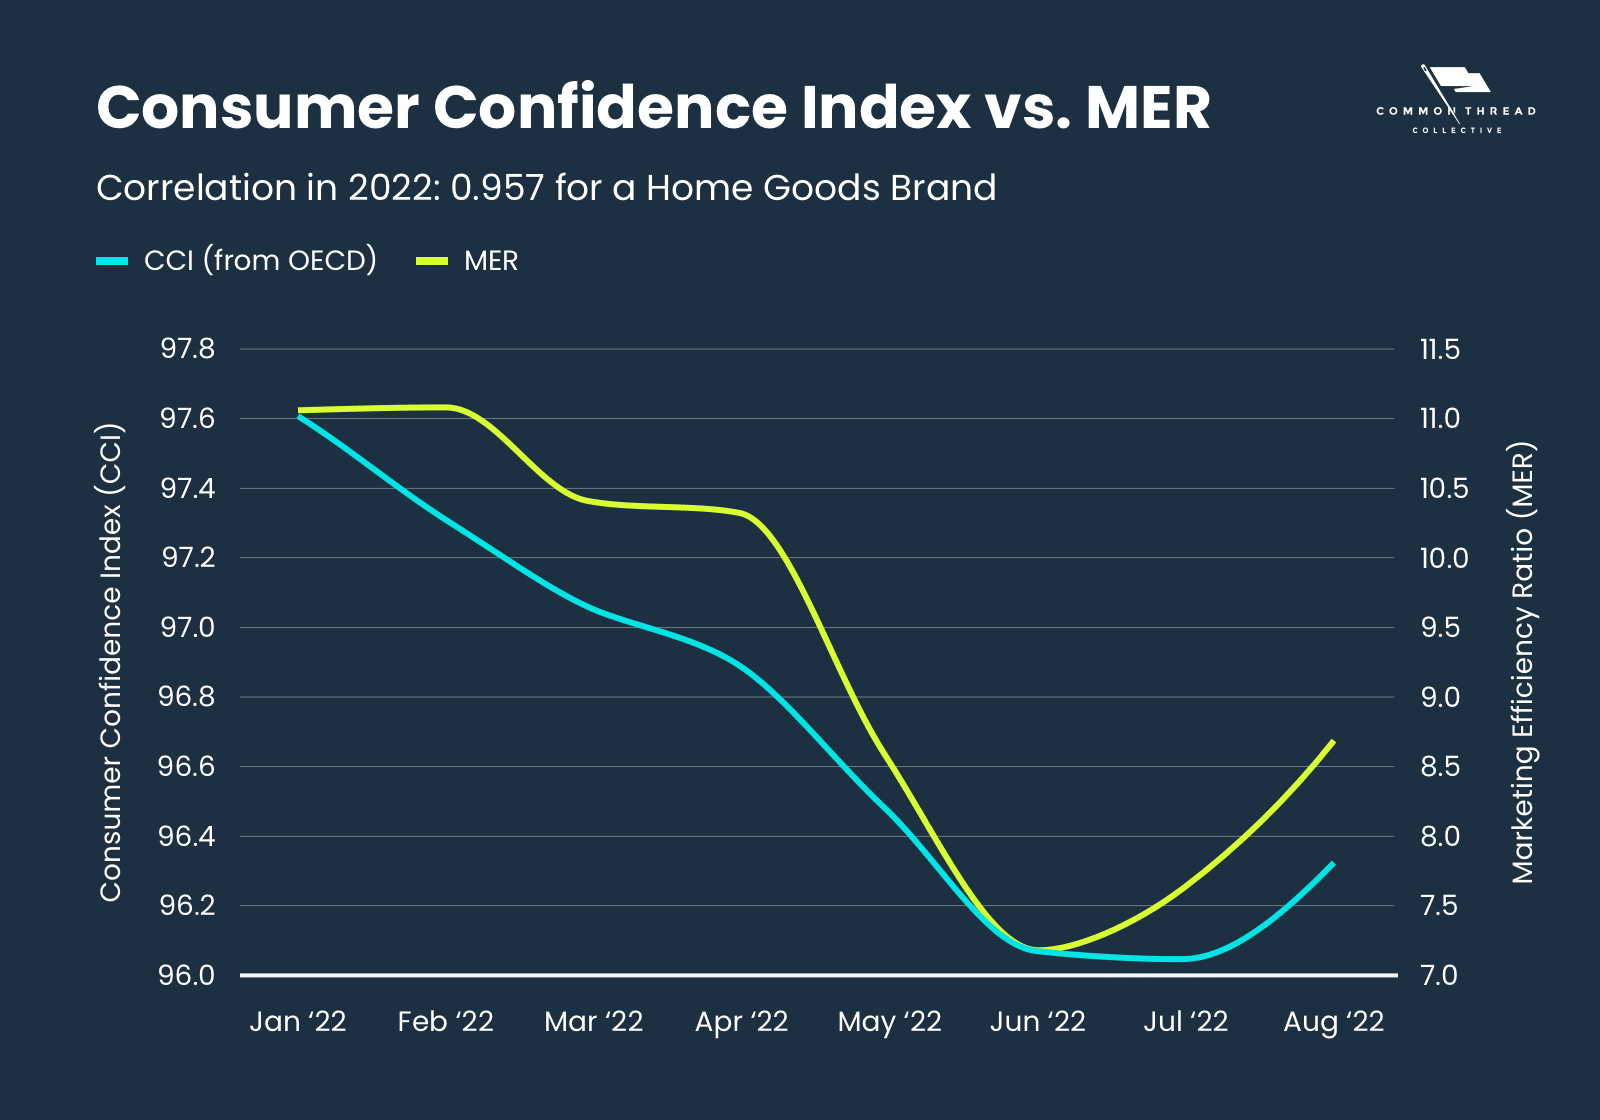
Furthermore, this relationship goes deeper than the aggregate level — a number of individual brands have a strong linear correlation between MER and CCI.
For instance, this home goods brand:
Some brands even exhibited a clear correlation between CCI and Acquisition Marketing Efficiency Ratio (aMER), which measures New Customer Revenue / Ad Spend:
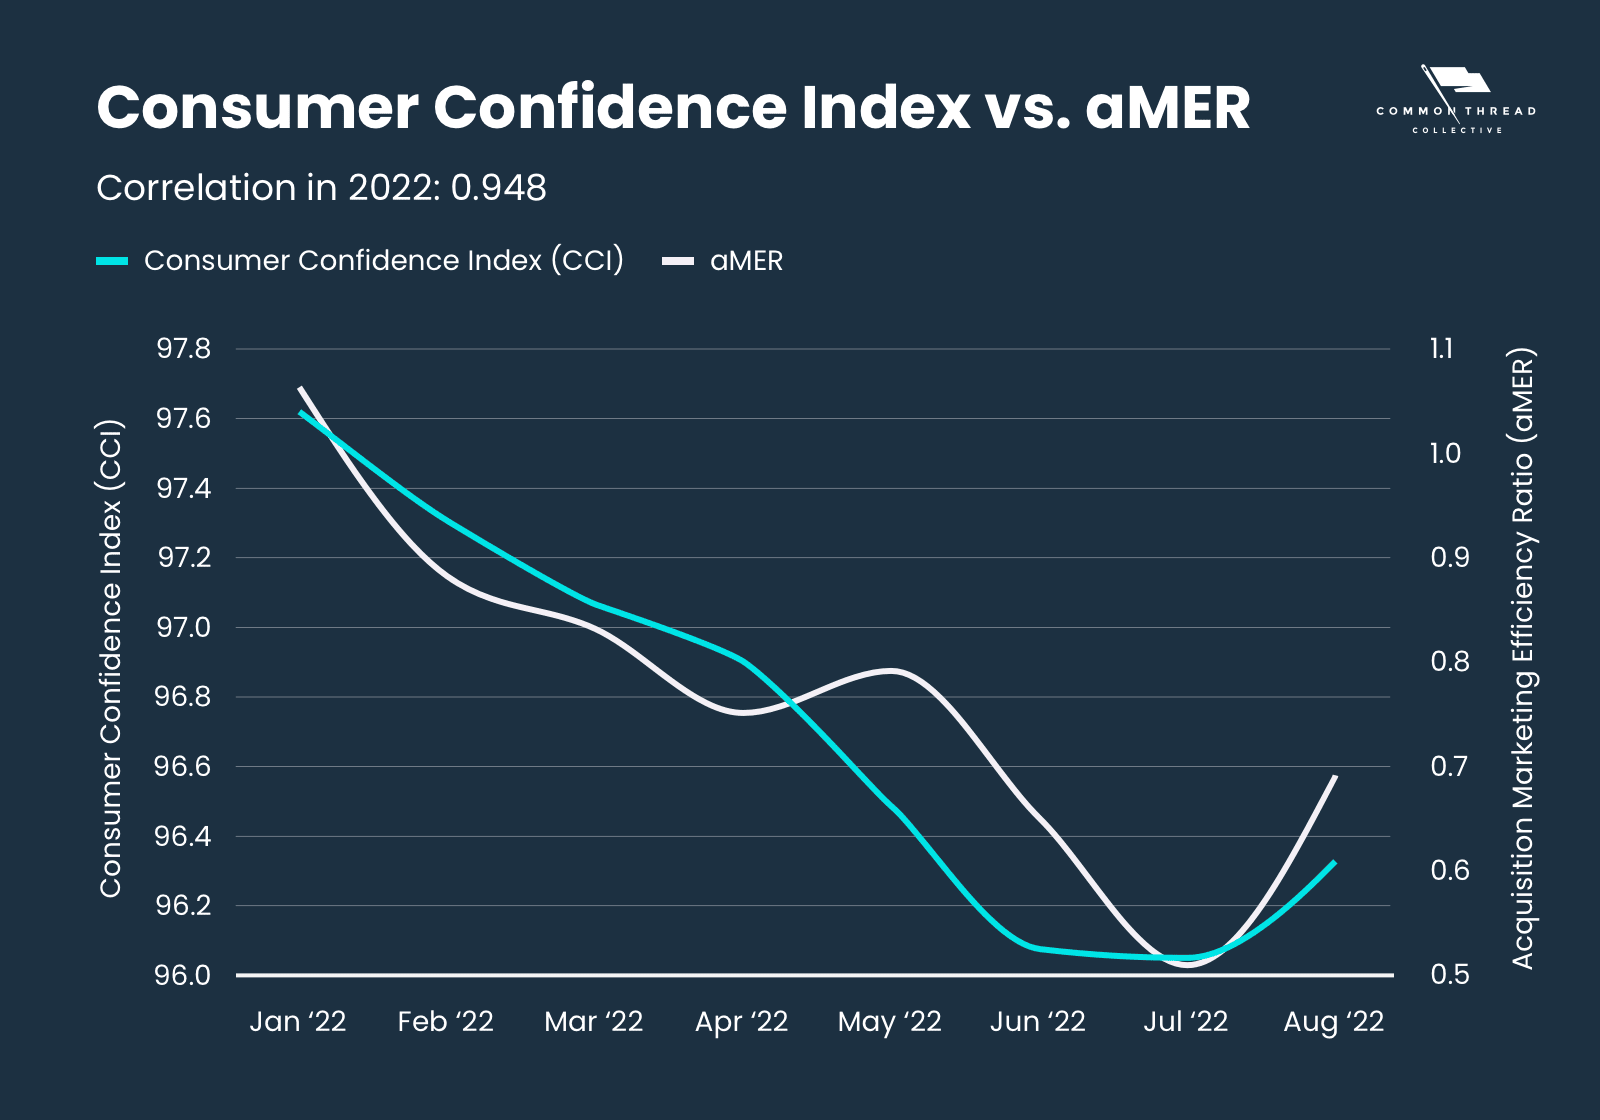
Those brands exhibited an even closer tie between CCI and their ability to attract new customers.
This learning is incredibly valuable in understanding how a brand is impacted by consumer sentiment. We’ve even used this lagging indicator as part of a model to predict Customer Acquisition Cost.
While Consumer Confidence is a useful metric, don’t throw everything else away just yet.
Consumer Confidence has 4 Drawbacks
1. It’s Lagging
Consumer Confidence is reported by OECD on the 2nd Monday in the month after: January’s Consumer Confidence was reported on Monday, February 13th. That tells us a lot about what happened in the last month, but doesn’t give much information about what is happening this month or in the future.
Sure, the Consumer Confidence Index does ask questions about the future of spending to formulate that model, but we found that the correlation starts declining after the month of the survey.
If we are asking consumers about their spending in October, but not reporting until mid November, that number just tells us more about what happened in the past and less about what’s going to happen in the future.
2. It’s Unreliable
Survey data is unreliable (people’s perception of their own behavior isn’t always accurate), and the CCI isn’t calibrated to any objective metric. This means there is no validation of the collective consumer’s actual behavior vs. what they said they would do.
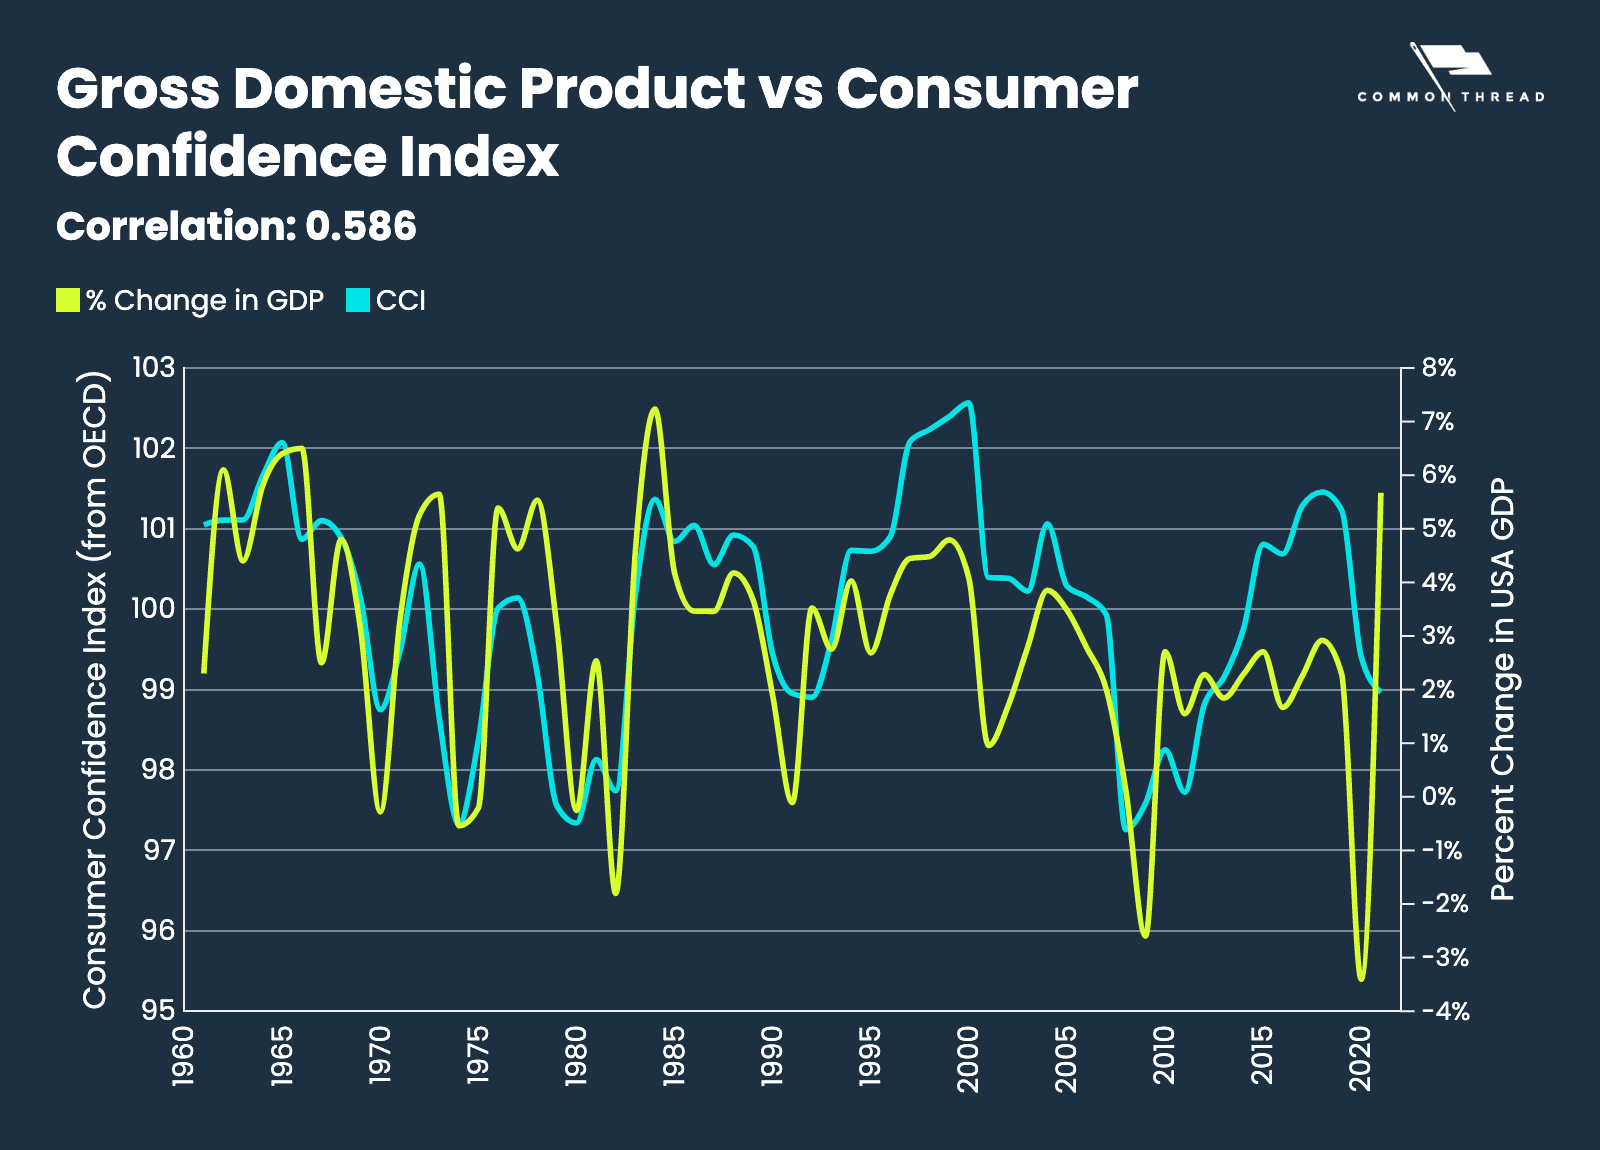
That said, the Consumer Confidence Index, when averaged into full year cohorts, has a decent correlation of 0.568 to GDP Growth year-over-year. This is the best correlation we found from CCI to general economic metrics over a long period of time.
3. It’s Not Specific to Ecommerce
The Consumer Confidence Index isn’t specific to ecommerce.
Remember those charts from earlier in the article with CCI correlating to MER and CAC?
There’s a reason we began those charts in September 2020 at the earliest:
Ecommerce MER diverged from CCI from March to September of 2020.
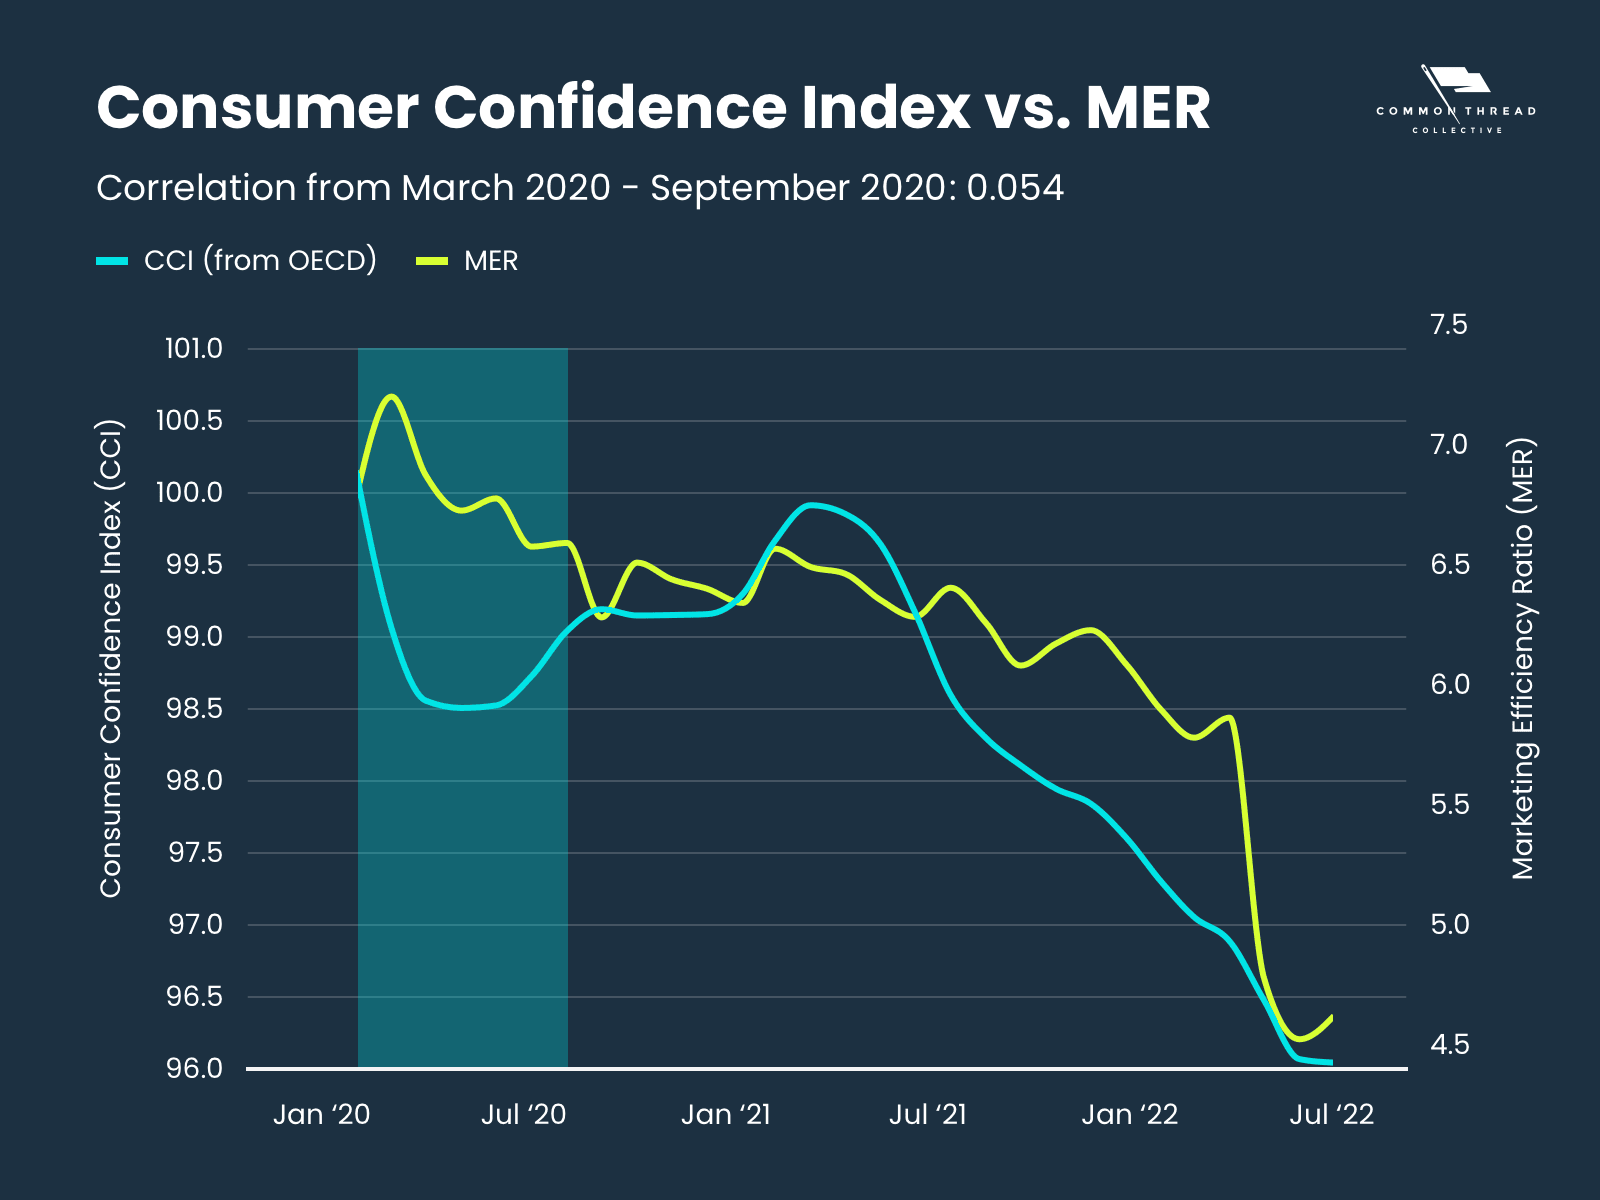
Consumer confidence and ecommerce MER became disconnected because of the pandemic — when everyone was staying at home, ecommerce saw a massive increase in sales while the rest of the economy foundered.
Though ecommerce often rises and falls with the overall economy, it diverges when people can’t leave their homes.
4. It Can’t Show Consumer Sentiment About YOUR Brand
Lastly, CCI can’t show you consumer sentiment about YOUR brand. A customer’s good feeling about their own financial situation doesn’t mean they feel good about using their money on your product.
The Consumer Confidence Index for Your Ecommerce DTC Business
The Consumer Confidence Index was born at a slower time, when managing a survey meant calling 5,000 people per month and tabulating their responses by hand.
We live in a different age, where real-time results can be garnered much faster and from a much larger data set.
It’s clear, however, that tracking consumer confidence is incredibly valuable …
Which is why we’re developing our own Consumer Confidence Index; a tool that addresses the four drawbacks above, and gives immediate results specific to ecommerce metrics.
Introducing the Direct To Consumer Confidence Index
To address the CCI’s shortcomings, we had two options:
Ask those large organizations to change the way they calculate and report CCI …
Or calculate a Consumer Confidence Index ourselves.
We partnered with Kno Commerce to deliver around 2,000 post-purchase consumer surveys per week to Ecommerce Consumers. From those survey results, we calculated our own Consumer Confidence Index.
We wanted to address the 4 main drawbacks that we noticed in the original Consumer Confidence Index and improve on them:
-
It’s more frequent and reported sooner. We’ll report our consumer confidence index weekly on Tuesday for the week that just ended on Sunday.
This delay of just 2 days lets brands take weekly action on the data.
-
It’s tied to measurable performance. We validate our number by tying it back to a measurable physical metric in the real world: Market Efficiency Ratio (MER). The higher the score on the CCI, the higher we expect MER to be for the upcoming week.
You heard that right: we validate our number by predicting MER for the coming week.
It’s no longer a lagging metric - like the old CCI value - but a leading metric.
-
It’s ecommerce-specific. All results represent immediate post-purchase survey feedback from ecommerce customers.
That means it accounts for the unique factors that differentiate Ecommerce from the broader retail world.
-
Brand specific. Each participating brand can see how their specific customer base feels about the market.
This all sounds great theoretically, but you probably want to see numbers.
Let’s get down to it.
Our charts begin on March 13th, the point at which we’d gathered enough survey data to make an impact.
We set the scale for DTCCI based on our aggregate MER from the DTC Index. This measured MER has moved between 4.8 and 7.4 throughout the history of Statlas; the middle of this range at 6.1 is set to 100 on the DTCCI with the numbers varying based on MER (an MER of 4.8 = 78.69 on DTCCI; an MER of 7.4 = 121.31 on DTCCI).
We’ve seen the Consumer Confidence improve +18% from its lowest point during the week starting on April 10th to its current value of 104.7 (as of June 15th).
The high of 105.5 occurred during the week starting May 15th.
Remember when we mentioned predicting MER?
We’re putting our money where our mouth is:
If we scale our Consumer Confidence Index, we can actually use it to predict the MER for the next week.
Here’s our MER predictions charted against actual performance:
Our model for MER had a Mean Absolute Error (MAE) of 0.12 in predicting MER for the week of June 12th (as of June 15th writing).
Based on this model, we predict that MER will increase +7% for the week of June 12th to a value of 6.39. We will report back on this number.
We are excited to continue this research with our partners at Kno Commerce. While we think our approach is much more useful than the existing Consumer Confidence Index, we understand this survey and modeling is a work in progress — if you want to keep up-to-date on the DTCCI, please follow along at dtcci.co.
Never Miss an Article
Subscribe to the CTC Newsletter and get more tactical insights for growing DTC brands. Weekly(ish) guidance from the frontlines.
Unsubscribe anytime.
Steve Rekuc is the Ecommerce Data Analyst at Common Thread Collective. Based in Vail, Colorado, he has been analyzing data from a systems perspective since his time as a graduate student at Georgia Tech two decades ago. Steve can be found on Twitter and LinkedIn examining data and providing interesting insights into ecommerce, marketing, and data analysis.