
Here are the 10 Metrics that define a fast-growing brand:
-
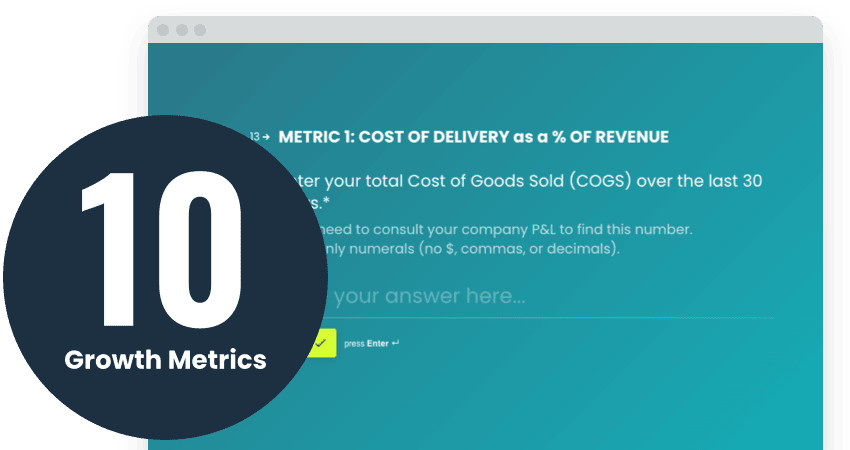
COD %
Your cost of delivery (all variable costs) as a percentage of revenue.
-
OPEX %
Your operating expenses (all fixed costs) as a percentage of revenue.
-
CCC
Your Cash Conversion Cycle: The number of days it takes to turn invested cash into cash on hand.
-
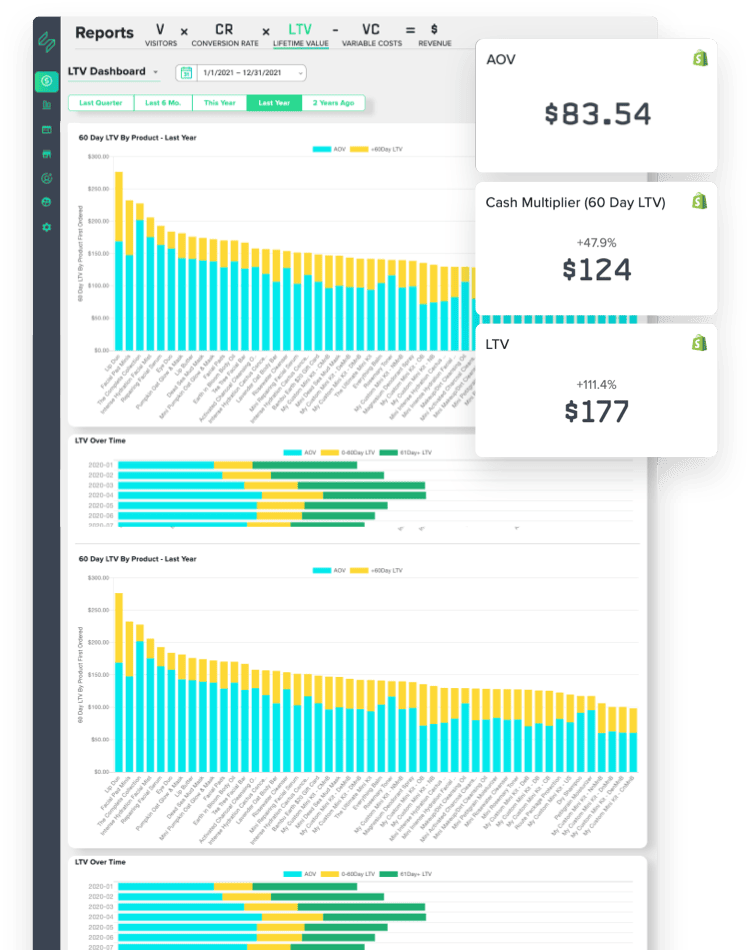
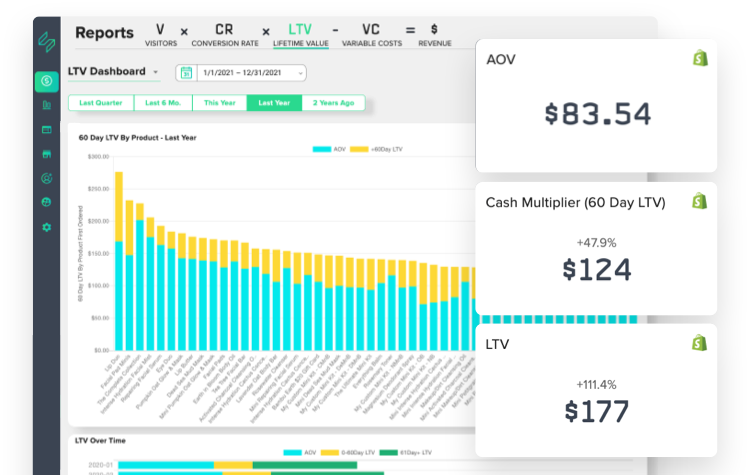
60-Day LTV %
The average % increase in customer value 60 days after first purchase.
-
1-Year LTV %
The average % increase in customer value 365 days after first purchase.
-
FOV:nCAC
The ratio of first-order value to new-customer acquisition costs.
-
# Distribution Channels
How many revenue sources your brand has (e.g. ecommerce, wholesale, brick-and-mortar).
-
Organic Traffic %
The percentage of traffic that comes from organic, rather than paid, sources
-
1-Year LTV:nCAC
The ratio of 1-year customer value to new-customer acquisition costs.
-
Revenue Peaks
The number of months in the year where revenue outperforms the mean by at least 25%.
-
COD %
Your cost of delivery (all variable costs) as a percentage of revenue.
-
OPEX %
Your operating expenses (all fixed costs) as a percentage of revenue.
-
CCC
Your Cash Conversion Cycle: The number of days it takes to turn invested cash into cash on hand.
-
60-Day LTV %
The average % increase in customer value 60 days after first purchase.
-
1-Year LTV %
The average % increase in customer value 365 days after first purchase.
-
FOV:nCAC
The ratio of first-order value to new-customer acquisition costs.
-
# Distribution Channels
How many revenue sources your brand has (e.g. ecommerce, wholesale, brick-and-mortar).
-
Organic Traffic %
The percentage of traffic that comes from organic, rather than paid, sources
-
1-Year LTV:nCAC
The ratio of 1-year customer value to new-customer acquisition costs.
-
Revenue Peaks
The number of months in the year where revenue outperforms the mean by at least 25%.