Book Your Strategy Audit
Need help building your marketing calendar? Book an audit call with our strategy team to get started on your profit-first gameplan.
Get Started

by Cara Wood
Mar. 17 2023
You know the joke about weather forecasters — it’s the only job where you can be wrong 50% of the time and you’re still doing a good job. Truth is, that’s not entirely wrong.
Any qualified forecaster, weather or not, will tell you good forecasting isn’t fortune-telling.
It’s a deep understanding of your historical data applied to your plans for the future.
In other words, forecasting is really an exercise in understanding what happened yesterday.
When I first started forecasting, I found it terrifying.
In fact, I held a party after I finished my final in the last math class I ever had to take; as you can imagine, working through spreadsheets is not exactly my jam.
So the good news for you is that if I can do this, you can do this.
If good forecasting is an exercise in understanding what happened yesterday, then step one is to track yesterday’s data correctly.
I personally use Google Analytics to track the data I need to forecast, so I make sure I apply UTM tags to all of my email links correctly. ALL of them. Not a single link gets to be UTM-free.
I work primarily in Klaviyo for my clients, which lets you set universal tagging parameters directly. Here’s what mine look like:
![]()
Note that flows and campaigns are tagged differently. It’s important to separate your blast sends from your automated sends, because the math done for each is slightly different.
Assuming you’ve been running your emails for at least 90 days with the correct UTMs, it’s time to go to Google Analytics to export revenue data by individual email into your preferred math sheet. (I use Google Sheets.)
To get the revenue data of each individual email sent during a time period, go to “All Campaigns,” then break it up by the secondary dimension “Source.” Make sure you set the time period you’re interested in. Then hit export.
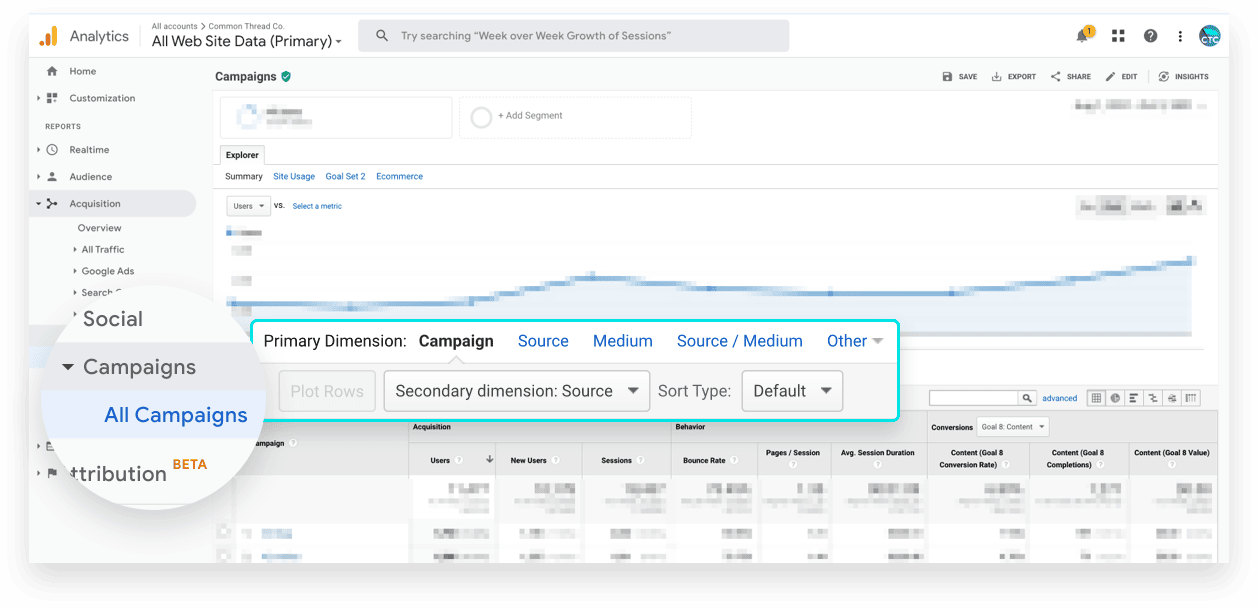
My default window is 90 days.
However, if a brand I’m working with sends very, very frequently, I might drop to 30 days.
And if the brand rarely sends, I might open up that time period to 6 months or more.
The main deciding factor is data:
It’s not just about choosing the length of the time period. You have to choose the right time period.
That is, the time period you’re analyzing should look similar to the time period you’re forecasting in terms of expected site traffic, subscriber numbers, and site promotions.
Functionally, that means don’t forecast January from November/December data, as the holiday spike causes you to over-forecast. (I often forecast January from August or September of the previous year.)
What you need in your sheet is the email campaign name (or flow email name) and the revenue made by each email.
That’s really it.
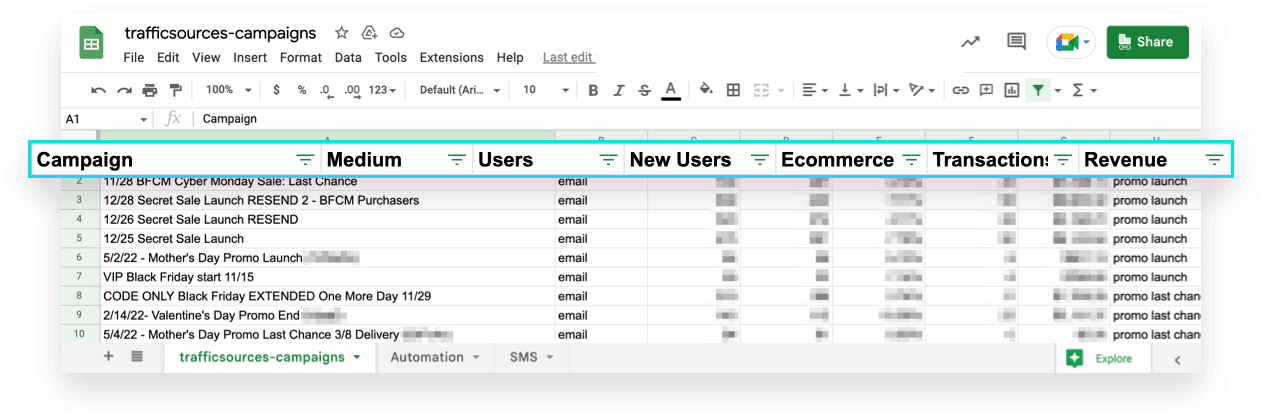
You can see above I usually leave users, eCommerce, and transactions from each email in my sheet as well — it helps me personally determine if a test email is showing up in GA. For instance, if an email campaign is showing 2 sessions and no revenue, that’s likely the test send and I can delete that data. (And I leave medium in so I can forecast for SMS and email in the same sheet.)
That said, if you have a live send with 2 clicks and no revenue, that’s important data for your averages.
I remove all other data.
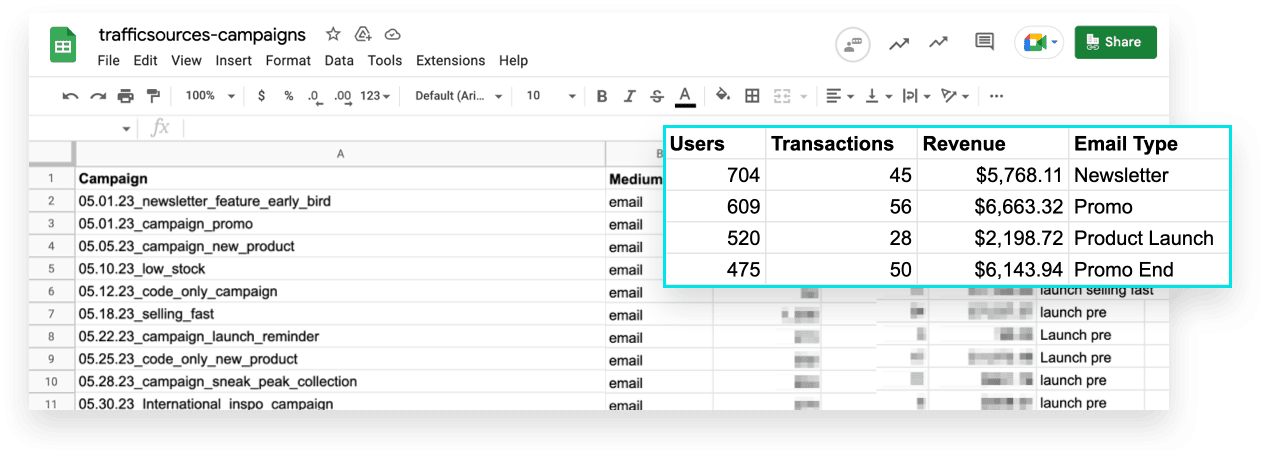
Your end goal with this step is to bucket similar revenue-drivers together.
For example: if you find that emails announcing a BOGO promo make 30% less revenue than emails announcing sitewide promos, label those two types of emails separately.
Coming up with a niche label instead of bucketing all promos together allows you to more accurately forecast for upcoming BOGO or sitewide promo sends.
To implement this, first separate your automated sends from your blast sends.
Then, for each automated email, label them by flow (Welcome, Abandoned Cart, etc.).
I typically only label a few top performing flows I want to track individually, and the rest I lump into an “other flows” category.
For one-off email campaigns, categorize by content or segment. This means that you’ll label sends with promotional content differently than sends with evergreen content.
On the flip side, you don’t want to over-categorize so that you end up with only one or two emails in each label. At that point, you’re not generating data that’s demonstrative of average performance.
Don’t worry, if I can do it, you can do it.
For campaigns: Take the total revenue of each category type and divide by the number of sends. Now you’ve got the average amount of revenue an email of that category type makes.
For flows: Take the total revenue from each flow type and divide by the number of days in the period you pulled from. And there’s the average revenue each flow makes you daily.
Once you know your averages, apply them to the upcoming month’s campaign calendar by classifying each planned send into one of your categories. Then, fill in the expected daily revenue from flows.
For example — if we know a BOGO campaign generates $1000 per email, we simply count the number of planned BOGO sends, multiply that number by $1000 and voila — we have a picture of what next month’s revenue will be.
Pretty cool when you see it rolled out!

Typically, your first month of forecasting isn’t going to be very accurate, but as you get to know your data, you’ll get pretty darn close.
And for retention marketers, that may be the most important part about forecasting email revenue:
It forces you to get a really clear understanding of your email content and segment behavior.
My final note: Forecasting is as much art as it is science. I’ve laid out the basics here, but no one knows your audience and sends better than you. At times you may choose to leave outliers out of a data set, use an unexpected time period, or re-forecast the remainder of the month based solely on how week one went.
Need help building your marketing calendar? Book an audit call with our strategy team to get started on your profit-first gameplan.
Get Started
Cara Wood is a Retention Strategy Manager at Common Thread Collective. She’s been in email marketing for nearly a decade. When she isn’t jamming on new retention strategies for ecommerce brands, she can be found trying to keep her beagle out of the trash. Connect with her on Twitter.